 Global| Oct 18 2007
U.S. Leading Economic Indicators Rose
by:Tom Moeller
|in:Economy in Brief
Summary
In September, the composite index of leading economic indicators gained back 0.3% of the prior month's 0.8% decline. It was revised from the initial report of a 0.6% decline, according to the Conference Board. During the last ten [...]
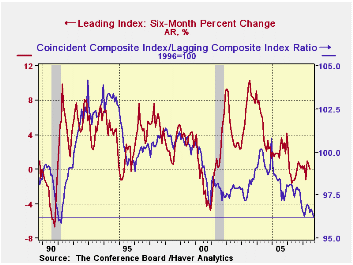
In September, the composite index of leading economic indicators gained back 0.3% of the prior month's 0.8% decline. It was revised from the initial report of a 0.6% decline, according to the Conference Board.
During the last ten years there has been a 59% correlation between the y/y change in the leading indicators index and the lagged change in real GDP.
The breadth of one month gains amongst the 10 components of the leading index improved to 75.0% from the abysmal 20% during August. Over a six month period, the breadth of gain amongst the leaders components was stable for the third month at 60%.
Higher stock prices, vendor performance and capital good orders made the largest positive contributions to the index's rise, offsetting a huge negative .20% contribution from lower building permits.
The method of calculating the contribution to the leading index from the spread between 10 year Treasury securities and the Fed funds rate has been revised. A negative contribution will now occur only when the spread inverts rather than when declining as in the past. More details can be found here.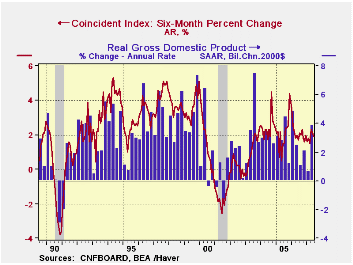
The leading index is based on eight previously reported economic data series. Two series, orders for consumer goods and orders for capital goods, are estimated.
The coincident indicators rose 0.2% after a 0.1% rise during August. Over the last ten years there has been a 86% correlation between the y/y change in the coincident indicators and real GDP growth.
The lagging index rose a firm 0.5% during August mostly due to higher C&I loans and a longer duration of unemployment. Nevertheless, the ratio of coincident to lagging indicators (a measure of economic excess) fell to its lowest level since 1991.Visit the Conference Board's site for coverage of leading indicator series from around the world.
| Business Cycle Indicators | September | August | Y/Y | 2006 | 2005 | 2004 |
|---|---|---|---|---|---|---|
| Leading | 0.3% | -0.8% | 0.2% | 1.2% | 2.5% | 7.1% |
| Coincident | 0.2% | 0.1% | 2.0% | 2.5% | 2.1% | 2.0% |
| Lagging | 0.5% | 0.3% | 3.6% | 3.0% | 3.5% | 0.6% |
by Tom Moeller October 18, 2007
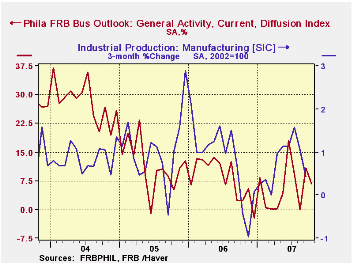
The Philadelphia Federal Reserve Bank's Index of General Business Conditions in the manufacturing sector dipped in October. The decline to 6.8 followed a great improvement in September to 10.9.
During the last ten years there has been a 59% correlation between the level of the Philadelphia Fed Business Conditions Index and the three-month growth in factory sector industrial production. There has been a 42% correlation with q/q growth in real GDP.
Fewer new orders and shipments seemed to account for much of the overall decline in the general index while employment improved. During the last ten years there has been a 75% correlation between the employment index and the three-month growth in factory payrolls.
The business conditions index reflects a separate survey question, not the sub indexes.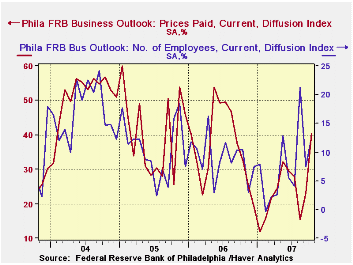
The prices paid index improved to its highest level since August of last year. During the last ten years there has been a 76% correlation between the prices paid index and the three-month growth in the intermediate goods PPI. There has been an 85% correlation with the change in core intermediate goods prices.
The separate index of expected business conditions in six months fell slightly but remained near its best level since late in 2004. Expectations for new orders were quite firm and though expectations for the number of employees fell from its recent high, it remained firm.
Subprime Side Effects in the Federal Funds Market from the Federal Reserve Bank of St. Louis can be found here.
| Philadelphia Fed Business Outlook | October | September | Oct. ‘06 | 2006 | 2005 | 2004 |
|---|---|---|---|---|---|---|
| General Activity Index | 6.8 | 10.9 | 2.3 | 8.1 | 11.5 | 28.1 |
| Prices Paid Index | 40.3 | 23.1 | 32.7 | 36.6 | 40.1 | 51.2 |
by Tom Moeller October 18, 2007
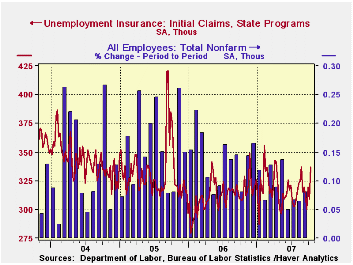
Initial claims for unemployment insurance jumped 28,000 to 337,000 last week and reversed all of the improvement of the prior five weeks.
The latest figure covers the survey period for October nonfarm payrolls and claims rose 24,000 (7.7%) from the September period.
The rise by far exceeded Consensus expectations for a gain to 313,000 claims. The four-week moving average of initial claims rose sharply to 316,500 (1.9% y/y).
A claims level below 400,000 typically has been associated with growth in nonfarm payrolls. During the last six years there has been a (negative) 78% correlation between the level of initial claims and the m/m change in nonfarm payroll employment.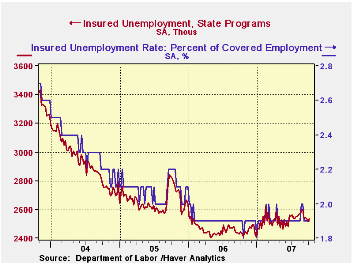
Continuing claims for unemployment insurance rose for the second week in the last five but it did not reverse the declines during the prior two.
The continuing claims numbers lag the initial claims figures by one week.
The insured rate of unemployment was stable at 1.9%, off the peaks in August of 2.0% held for two consecutive weeks at month- end.
The latest Beige Book covering regional economic activity from the Federal Reserve Board can be found here.
| Unemployment Insurance (000s) | 10/13/07 | 10/06/07 | Y/Y | 2006 | 2005 | 2004 |
|---|---|---|---|---|---|---|
| Initial Claims | 337 | 309 | 9.4% | 313 | 331 | 343 |
| Continuing Claims | -- | 2,534 | 3.7% | 2,545 | 3.3% | 2,459 |
by Robert Brusca October 18, 2007
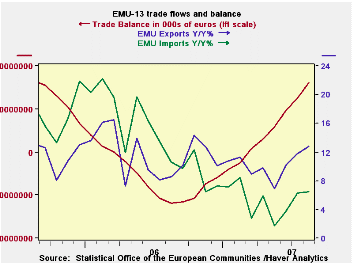
European trade is proving to be resilient in the face of a strongly rising euro currency. Some of this is undoubtedly the reflection of true strength, but some is also the acumen of the European exporters who have learned to use markets to hedge and some perhaps to giving back some profit margins as the euro puts an increasingly strong squeeze on margins and makes even hedging less of a dodge for foreign exchange rate induced pressures. Euro area data show that foreign orders have been slipping and remarks by policymakers and businesses leaders indicate that businesses are feeling the pinch. So far the data only show that exports are not just growing but also accelerating. Imports have slowed and that is particularly clear in the six-month growth rates. Over three months both exports and imports are locked into some real strength. The growing surplus is again poised to augment EMU growth in Q3.
| m/m% | % Saar | ||||
| Aug-07 | Jul-07 | 3M | 6M | 12M | |
| Balance* | €€ 4,345 | €€ 809 | €€ 3,301 | €€ 3,650 | €€ 2,679 |
| Exports | |||||
| All exports | 4.9% | -0.9% | 28.9% | 11.9% | 12.8% |
| Food and drinks | 2.8% | 2.5% | 36.5% | 10.7% | 13.4% |
| Raw materials | -0.6% | -1.5% | 0.4% | 9.5% | 12.6% |
| MFG | 2.8% | -0.3% | 26.1% | 6.3% | 11.5% |
| Imports | |||||
| All imports | 2.0% | 2.4% | 27.7% | 7.1% | 6.5% |
| Food and drinks | -0.1% | 0.7% | 22.7% | -2.7% | 6.2% |
| Raw materials | 0.2% | 2.3% | 19.5% | 2.1% | 6.1% |
| MFG | 0.5% | 1.5% | 23.3% | -0.8% | 8.7% |
| *Million Euros; mo or period average | |||||
by Robert Brusca October 18, 2007
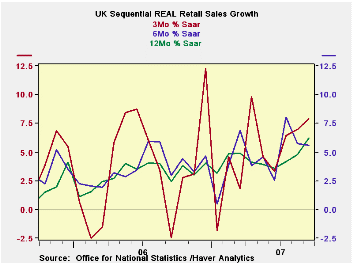
UK retail sales are accelerating. The acceleration is real as the volume graph on the left shows. The table’s growth calculations show that upsurge has not been steadily building but is nonetheless across the main categories over the past three months with food sales leading the nominal acceleration part of that due to prices, no doubt. Clothing sales are accelerating too, but that is after a flat six-month growth rate, and to a growth rate marginally stronger than the 12-month rate. The surge in volume growth in the last three months is striking. In the quarter now complete sales volumes are up at a 7.1% annualized pace.
| Nominal | Sep-07 | Aug-07 | Jul-07 | 3-MO | 6-MO | 12-MO | YrAGo |
| Retail Total | 0.5% | 0.9% | -0.4% | 4.1% | 3.2% | 4.6% | 2.9% |
| Food Beverages & Tobacco | 0.9% | 1.8% | -0.5% | 8.8% | 3.9% | 3.6% | 4.0% |
| Clothing footwear | 0.6% | 1.3% | -0.4% | 6.0% | 0.0% | 5.8% | 2.1% |
| Real | |||||||
| Retail Ex Auto | 0.6% | 0.7% | 0.7% | 7.9% | 5.6% | 6.2% | 2.4% |

Tom Moeller
AuthorMore in Author Profile »Prior to joining Haver Analytics in 2000, Mr. Moeller worked as the Economist at Chancellor Capital Management from 1985 to 1999. There, he developed comprehensive economic forecasts and interpreted economic data for equity and fixed income portfolio managers. Also at Chancellor, Mr. Moeller worked as an equity analyst and was responsible for researching and rating companies in the economically sensitive automobile and housing industries for investment in Chancellor’s equity portfolio. Prior to joining Chancellor, Mr. Moeller was an Economist at Citibank from 1979 to 1984. He also analyzed pricing behavior in the metals industry for the Council on Wage and Price Stability in Washington, D.C. In 1999, Mr. Moeller received the award for most accurate forecast from the Forecasters' Club of New York. From 1990 to 1992 he was President of the New York Association for Business Economists. Mr. Moeller earned an M.B.A. in Finance from Fordham University, where he graduated in 1987. He holds a Bachelor of Arts in Economics from George Washington University.
More Economy in Brief


