 Global| Jul 13 2007
U.S. June Retail Sales Fell After Huge Gain in May
by:Tom Moeller
|in:Economy in Brief
Summary
In June, US retail sales fell 0.9% after a 1.5% gain during May that was revised from 1.4%. The figure for last month fell short of Consensus expectations for a modest 0.1% rise. Excluding autos, retail sales fell 0.4% but a revised [...]
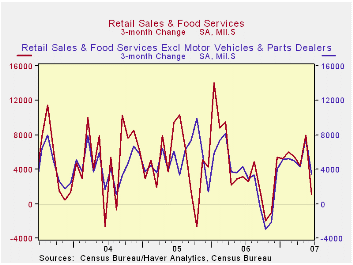
In June, US retail sales fell 0.9% after a 1.5% gain during May that was revised from 1.4%. The figure for last month fell short of Consensus expectations for a modest 0.1% rise.
Excluding autos, retail sales fell 0.4% but a revised 1.6% rise during May was initially reported as up 1.3%.Expectations were for a 0.2% increase.Nonauto retail sales less gasoline fell 0.3% (+4.6% y/y) last month after a revised 1.3% spurt during May, initially reported at up 1.0%.
Sales by motor vehicle & parts dealers fell 2.9% (+2.0% y/y), even though new unit vehicle sales fell 3.5% m/m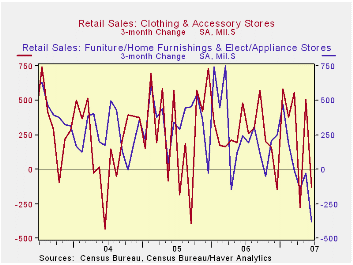
Gasoline service station sales fell 1.1% after a 4.1% surge during May which reflected a 10.6% ruse in gas prices at the pump which then fell 2.9% during June to an average $3.06 per gallon (5.9% y/y).
Sales of discretionary items were generally firm last month. Sales at general merchandise stores added 0.3% (4.8% y/y) after an upwardly revised 1.0% May increase.Apparel store sales fell 1.4% (+4.8% y/y) after a 2.5% spurt during May. Furniture, home furnishings & appliance stores posted one of weakest showings last month with a 2.2% (-0.1% y/y) decline after a modest 0.7% May rise.
Building material sales fell 2.3%% (-0.1% y/y). Sales of nonstore retailers (internet & catalogue) rose 1.2% (9.5% y/y) but restaurant and bar sales rose only 0.1% (5.9% y/y) after a 0.6% May increaseHow Worrisome Is a Negative Saving Rate? From the Federal Reserve Bank of New York can be found here.
| June | May | Y/Y | 2006 | 2005 | 2004 | |
|---|---|---|---|---|---|---|
| Retail Sales & Food Services | -0.9% | 1.5% | 3.8% | 6.2% | 6.6% | 6.1% |
| Excluding Autos | -0.4% | 1.6% | 4.2% | 7.3% | 7.6% | 7.1% |
by Tom Moeller July 13, 2007
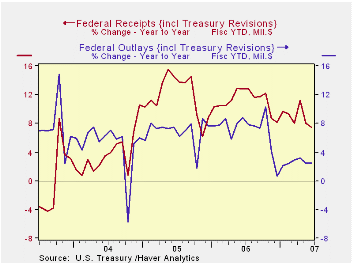 Net revenues grew 7.5% y/y during the first nine months of FY07. Individual income tax receipts (44% of total receipts) grew 11.5%. Corporate income taxes (13% of total receipts) were down sharply as were estate & gift taxes. Higher employment levels raised employment contributions by 4.2%.
U.S. net outlays grew 2.5% during this fiscal year's first nine months versus last year driven by a 5.6% rise in defense spending (19% of total outlays). Medicare expenditures (12% of outlays) surged by14.7% while social security spending (21% of outlays) rose 5.7%. The government's interest expense rose by 4.6% y/y as interest rates have risen.
| US Government Finance | June | May | Y/Y | FYTD 2007 | FY 2006 | FY 2004 |
|---|---|---|---|---|---|---|
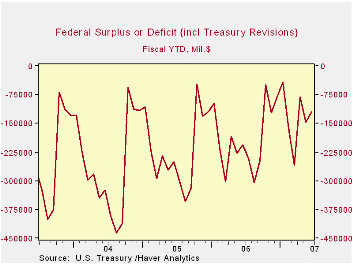
| Budget Balance | $27.5B | $-67.7B | $20.5B (6/06) |
-$247.7 | -$318.7B | -$412.7B |
| Net Revenues | $276.5B | $164.2B | 4.6% | 7.5% | 11.8% | 14.6% |
| Net Outlays | $206.6B | $231.9B | 2.1% | 2.5% | 7.4% | 7.8% |
by Tom Moeller July 13, 2007
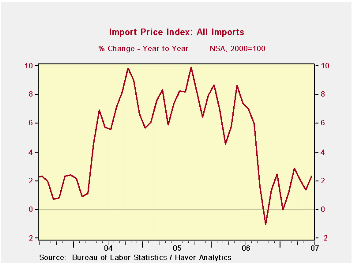
The increase occurred as petroleum import prices surged 4.7% in June after sharp increases during five of the prior six months. Further increases in July in the price of Brent crude oil to $77.12 from an average $71.0 during June promise another price gain this month.
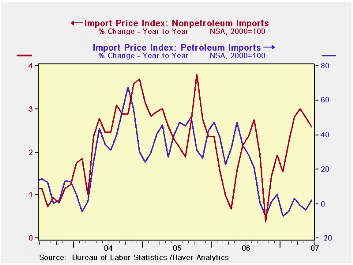 Less petroleum import prices rose a modest 0.2 following the May jump of 0.5%. During the last ten years there has been a 66% (negative) correlation between the nominal trade-weighted exchange value of the US dollar vs. major currencies and the y/y change in non oil import prices. The correlation is a lower 47% against a broader basket of currencies.
Why a Dollar Depreciation May Not Close the U.S. Trade Deficit from the Federal Reserve Bank of New York is available here
Prices for industrial supplies & materials surged 2.6% (4.4% y/y) due to surge in oil prices. Less oil these prices rose 0.5% (7.5% y/y).
Capital goods prices rose 0.2% (-0.1% y/y) after no change in May. Computers, peripheral and semiconductors fell 0.1% (-5.2% y/y) and less high tech, capital goods prices were unchanged (3.1% y/y). Prices for nonauto consumer goods were unchanged (1.5% y/y).
Less petroleum import prices rose a modest 0.2 following the May jump of 0.5%. During the last ten years there has been a 66% (negative) correlation between the nominal trade-weighted exchange value of the US dollar vs. major currencies and the y/y change in non oil import prices. The correlation is a lower 47% against a broader basket of currencies.
Why a Dollar Depreciation May Not Close the U.S. Trade Deficit from the Federal Reserve Bank of New York is available here
Prices for industrial supplies & materials surged 2.6% (4.4% y/y) due to surge in oil prices. Less oil these prices rose 0.5% (7.5% y/y).
Capital goods prices rose 0.2% (-0.1% y/y) after no change in May. Computers, peripheral and semiconductors fell 0.1% (-5.2% y/y) and less high tech, capital goods prices were unchanged (3.1% y/y). Prices for nonauto consumer goods were unchanged (1.5% y/y).
Export prices rose 0.3%. Nonagricultural export prices rose just 0.1% (2.9% y/y).
| Import/Export Prices (NSA) | June | May | Y/Y | 2006 | 2005 | 2004 |
|---|---|---|---|---|---|---|
| Import - All Commodities | 1.0% | 1.1% | 2.3% | 4.9% | 7.5% | 5.6% |
| Petroleum | 4.7% | 3.7% | 2.1% | 20.6% | 37.6% | 30.5% |
| Non-petroleum | 0.2% | 0.5% | 2.6% | 1.7% | 2.7% | 2.6% |
| Export- All Commodities | 0.3% | 0.2% | 4.1% | 3.6% | 3.2% | 3.9% |
by Tom Moeller July 13, 2007
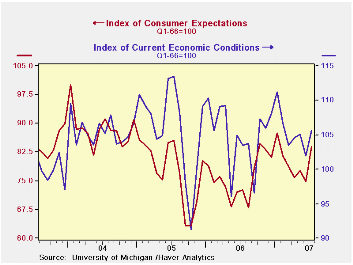
The University of Michigan's preliminary reading of consumer sentiment this month jumped 8.3% to 92.4, the highest level since January.The latest contrasted with Consensus expectations for only a reading of 86.
The consumer expectations contributed the most to the rise with a 12.3% surge m/m.Current conditions also rose 3.7% to the highest level since January.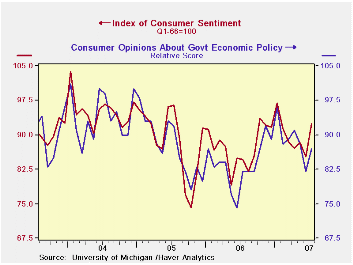
An improved expectation for business conditions during the next year contributed with a 17.0% m/m rise and a better outlook for the next five years contributed with an 18.2% surge.
The view of current personal finances rose 7.3% (7.3% y/y) but the perspective of current buying conditions rose just 1.3% (-1.3% y/y).
The assessment of government policy improved 6.1% (6.1% y/y) after falling sharply during the prior two months.
The University of Michigan survey is not seasonally adjusted.This mid-month survey was based on telephone interviews with about 340 households nationwide on personal finances and business and buying conditions. The survey is expanded to a total of 500 interviews at month-end.
| University of Michigan | July (Prelim.) | June | Y/Y | 2006 | 2005 | 2004 |
|---|---|---|---|---|---|---|
| Consumer Sentiment | 92.4 | 85.3 | 9.1% | 87.3 | 88.6 | 95.2 |
| Current Conditions | 105.7 | 101.9 | 2.1% | 105.1 | 105.9 | 105.6 |
| Expectations | 83.9 | 74.7 | 15.7% | 75.9 | 77.4 | 88.5 |
by Carol Stone July 13, 2007
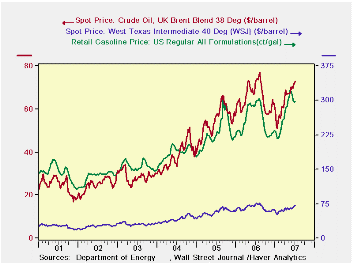
Gasoline prices turned up slightly in the latest week, ending July 9, but they remain below their May peaks. The latest reading from the Department of Energy (DOE) was $2.981/gallon, up 2.2 cents on the week. At least one reason for the week-to-week increase is the July 4 holiday and the beginning in earnest of the vacation driving season. The same week in 2006 saw $2.973/gallon, so the current level is less than a penny higher. Crude oil prices have also increased from week to week, and they are above their June levels. However, these are below year-ago prices.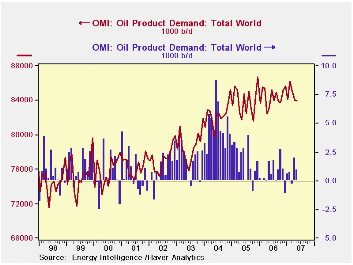
These steadier price trends suggest that pressures in the world oil market are diminishing. Indeed, conditions are easing, but relatively so. World product demand appears to have flattened out, with the latest estimate at about 84 million barrel/day through May, according to Oil Market Intelligence. [In Haver's OMI database; June figures are due out shortly.] This peaked in February at 86.2 mil. b/d. In the last several years, February has been each year's peak month, with June and August nearly as high. Year-on-year percentage increases are running somewhat slower than they did back in the autumn. So there are hints here that total demand has at least stopped accelerating, but potential increases due to seasonal needs over the summer keep us from a firm conclusion that it has stopped growing altogether.
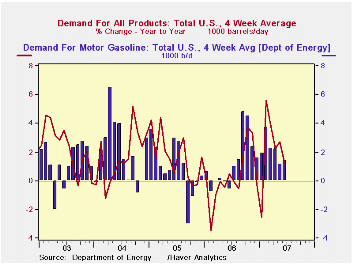
In the US, total product demand was 20.8 mil b/d in the latest DOE 4-week reading, almost exactly flat with a year ago. Aggregated to monthly averages, these data show an abrupt slowing of demand growth in June after 4 months that ran 2% to as much as 5.6% ahead of a year ago. Gasoline usage, similarly, is still increasing year-to-year, but noticeably less in the last 2 months than earlier this year. [These US product demand data are in OILWKLY; we have used the "Aggregation" feature of DLXVG3 to facilitate the monthly comparisons here.]
 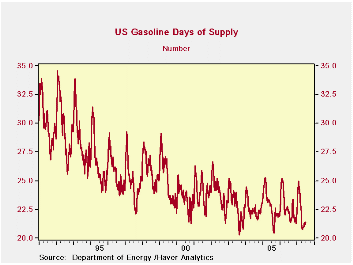 |
| · The tightness in these markets can be gauged by the adequacy of inventories. Here again, year-ago comparisons are still unfavorable, but they have been less bad lately than in prior months. The size of US gasoline stocks is down 3.3% in the July 9 week from the 2006 week, but in mid-May, they had been down 5.7% from the year-ago amount. With the less weak inventories and the less strong demand growth, the sector's version of an "inventory/sales ratio", the "days' supply" has stopped eroding. Gasoline stocks stood at 21.4 days' worth of gasoline demand last week, the same as the week before. The year-ago figure was 22.2 days; so this inventory measure is down from a year ago, but actually better than in late April, when it sank as low as 20.8 days. That was the lowest days' supply reading in the 16-1/2 years of this series, apart from those impacted by hurricanes in 2003 and 2005. Again, July and August are the most sensitive seasonal periods, so the performance of this measure too in the immediately coming weeks will tell more definitively about the vulnerability of oil and gasoline markets to higher prices. |
|---|
| Select Oil Market Indicators | July 9 | July 2 | June | Year- Ago Week | 2006 | 2005 | 2004 |
|---|---|---|---|---|---|---|---|
| Gasoline, US Regular Grade (cents/gal) | 298.1 | 295.9 | 305.6 | 297.3 | 257.2 | 227.0 | 185.2 |
| Crude: WTI ($/barrel) | 71.79 | 69.19 | 66.87 | 75.30 | 66.13 | 56.50 | 41.33 |
| Crude: UK Brent ($/barrel) | 72.75 | 71.69 | 70.58 | 73.80 | 65.19 | 54.58 | 38.10 |
| Gasoline Stocks: Days' Supply | 21.4 | 21.4 | 21.4 | 22.2 | 22.7 | 22.8 | 23.2 |
by Robert Brusca July 13, 2007
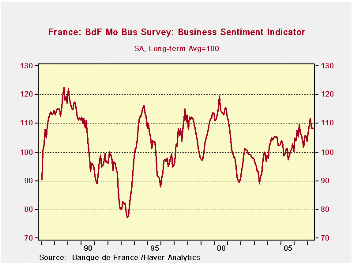
The BOF Outlook index hit a local peak from Mar 07; It is flat in June.
The Bank of France Business report is a comprehensive survey on businesses and their expectations. The table below is a summary of the more extensive report with industry detail. In that report the sentiment index at 108.2 is above its average since January 1987 that stands at 105. However, the index was flat on the month and it had reached its peak in this cycle at 111.89 in March. The index fell sharply from that peak and has stayed in a very tight range over the next three months.
French elections have taken place and the past few months are in the post election period; French consumer confidence has been on an extended rise in the wake of the elections.
As for business, the production outlook at 8.7 is below its average value of 12, although production in the current month at 10.8 is above its average value of 9.
Overall order books are stuffed compared with historic averages. The average for order books is +3 while the June reading is 26.8, the strongest category relative to its average by far. Foreign orders are also above normal at 12.1 compared to an average of 9. New orders are, however, not as robust at a level of 10.9 in June compared to an historic average of 10.
At 85.9, capacity use is above the historic norm of 84. Hiring in the current month at -1.8 is weaker than the monthly average of -1 while the outlook at -3.9 is better than the historic average of -6.
On balance, the BOF index is better than average. And while many of its component readings are above normal, most are not far above normal and there is some evidence of a loss in momentum.
| 12 MO | Since Jan-87 | 2Yr Percentile | ||||
| Jun-07 | May-07 | Apr-07 | AVERAGE | Average | rank/range | |
| Production-latest month | ||||||
| Total Industry | 10.77 | 9.52 | 6.59 | 8 | 9 | 61.3% |
| Production Outlook | ||||||
| Total Industry | 8.7 | 17.66 | 7.34 | 9 | 12 | 51.1% |
| Demand | ||||||
| Overall order books | 26.85 | 29.77 | 30.57 | 25 | 3 | 84.5% |
| Foreign Orders | 12.12 | 13.35 | 11.56 | 13 | 9 | 61.2% |
| New Orders | ||||||
| Total Industry | 10.89 | 13.11 | 8.68 | 11 | 10 | 49.4% |
| Stocks: Finished Goods | ||||||
| Total Industry | -1.4 | -2.68 | -5.36 | -2 | -2 | 57.3% |
| Capacity Utilization | 85.96 | 85.72 | 86.05 | 85 | 84 | 89.0% |
| Hiring | ||||||
| Latest Month | -1.84 | 2.25 | 0.36 | 0 | -1 | 28.4% |
| Outlook | -3.92 | -4.52 | -5.28 | -4 | -6 | 82.9% |
| Industry Sentiment Index | 108.21 | 108.26 | 108.36 | 107 | 105 | 75.4% |
by Robert Brusca July 13, 2007
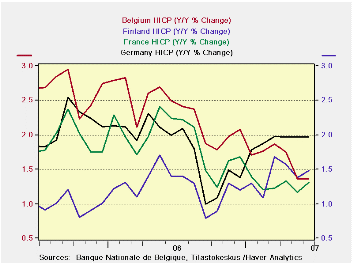
The accompanying charts show those EMU countries for which we have an early read on June inflation. Finland, Belgium and France show rates of change below the 2% mark. Germany, Italy and The Netherlands are also below the 2% ceiling, but by the skin of their teeth. Luxembourg and Spain are over the top.
It is heartening to see that some of the larger countries have the lower rates of inflation. And for most the pattern is clear. An oil price shock cranked up the inflation rates, but afterward those rates have come back down and are for the most part tolerably closer to the ECB’s ceiling.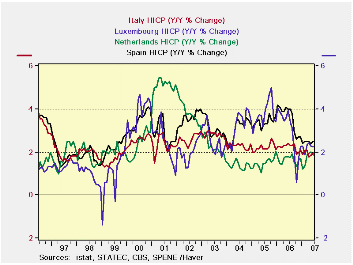
Still only France has an extended period in which its year/year pace has been consistently well below the ceiling pace of 2%. Finland’s and Belgium’s rates have just fallen into a more comfortable part of the zone recently. The Netherlands rate has recently risen toward the ceiling. While Germany and Italy are technical successes they have no reassuring history for us. Belgium and Luxembourg show no tendency to do better.
So it is quite understandable that the ECB would be wary in such an environment.
| % mo/mo | % saar | ||||||
| Jun-07 | May-07 | Apr-07 | 3-Mo | 6-Mo | 12-Mo | Yr Ago | |
| EMU-13 | #N/A | 0.2% | 0.4% | 3.0% | 2.4% | 1.9% | 2.5% |
| Core | #N/A | 0.2% | 0.3% | 3.1% | 2.5% | 1.9% | 2.4% |
| Goods | #N/A | 0.2% | 0.8% | 9.0% | 3.2% | 1.4% | 2.9% |
| Services | #N/A | 0.2% | 0.4% | 2.6% | 3.9% | 2.6% | 1.8% |
| HICP | |||||||
| Germany | 0.2% | 0.2% | 0.4% | 3.1% | 3.0% | 2.0% | 2.0% |
| France | 0.2% | 0.2% | 0.4% | 3.6% | 1.7% | 1.3% | 2.2% |
| Italy | 0.3% | 0.3% | -0.1% | 1.9% | 1.9% | 1.9% | 2.4% |
| UK | #N/A | 0.1% | 0.0% | #N/A | #N/A | #N/A | 2.5% |
| Spain | 0.3% | 0.3% | 0.3% | 3.4% | 3.3% | 2.4% | 3.9% |
| Core: xFE&A | |||||||
| Germany | #N/A | 0.3% | 0.3% | 2.0% | 2.2% | 2.1% | 0.6% |
| France | #N/A | 0.1% | 0.3% | 2.1% | 1.4% | 1.4% | 1.3% |
| Italy | #N/A | 0.2% | 0.0% | 2.0% | 1.8% | 1.9% | 1.7% |
| UK | #N/A | 0.3% | 0.0% | 2.4% | 2.2% | 2.2% | 1.3% |
| Spain | #N/A | 0.1% | 0.3% | 2.0% | 2.7% | 2.5% | 3.1% |
| Blue shaded area data trail by one month | |||||||

Tom Moeller
AuthorMore in Author Profile »Prior to joining Haver Analytics in 2000, Mr. Moeller worked as the Economist at Chancellor Capital Management from 1985 to 1999. There, he developed comprehensive economic forecasts and interpreted economic data for equity and fixed income portfolio managers. Also at Chancellor, Mr. Moeller worked as an equity analyst and was responsible for researching and rating companies in the economically sensitive automobile and housing industries for investment in Chancellor’s equity portfolio. Prior to joining Chancellor, Mr. Moeller was an Economist at Citibank from 1979 to 1984. He also analyzed pricing behavior in the metals industry for the Council on Wage and Price Stability in Washington, D.C. In 1999, Mr. Moeller received the award for most accurate forecast from the Forecasters' Club of New York. From 1990 to 1992 he was President of the New York Association for Business Economists. Mr. Moeller earned an M.B.A. in Finance from Fordham University, where he graduated in 1987. He holds a Bachelor of Arts in Economics from George Washington University.
More Economy in Brief


