 Global| Sep 09 2010
U.S. July Trade Deficit Improves Suggesting Some Reversal Of Its Drag On GDP
by:Tom Moeller
|in:Economy in Brief
Summary
Foreign trade numbers do bounce around, don't they? The July U.S. foreign trade deficit improved to $42.8B from a little-revised $49.8B in June. That improvement reversed virtually all of the June deepening which helped trade deficit [...]
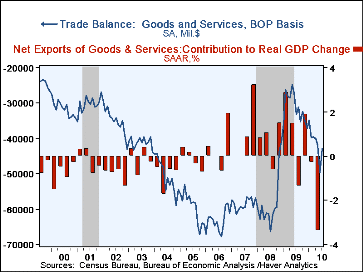
Foreign trade numbers do bounce around, don't they? The July U.S. foreign trade deficit improved to $42.8B from a little-revised $49.8B in June. That improvement reversed virtually all of the June deepening which helped trade deficit deterioration subtract 3.4 percentage points from 2Q GDP growth. Higher exports and lower imports left the deficit shallower than its 2Q average of $44.8B The July figure was shallower than Consensus expectations for a deficit of $47.3B.
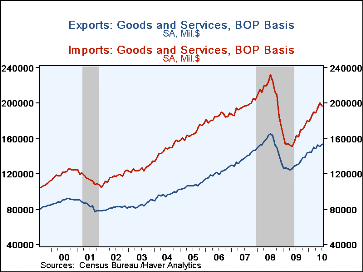
Exports rebounded 1.8% (18.3% y/y) following their 1.3% June shortfall. Though foreign economies are hardly strong, the weak value of the dollar has helped U.S. exports grow. Capital goods exports rebounded 6.2% (21.0% y/y) as exports of civilian aircraft jumped by nearly two-thirds (19.4% y/y) and computer exports surged 17.2% (19.4% y/y). Exports of "other" goods also jumped 11.0% (43.8% y/y). Exports of industrial supplies & materials rose 1.6% (30.7% y/y). That, however, is where the story of last month's strength ends. Auto exports fell a hard 3.9% though they're still up by one-third y/y. Nonauto consumer goods exports slipped 0.1% (+9.1% y/y). Services exports also ticked 0.1% lower (+10.3% y/y). The lower value of the dollar encouraged visits to the U.S., pushing travel exports up by 13.0% y/y while passenger fares rose by one-quarter. Exports of other private services rose 7.0% versus 2009.
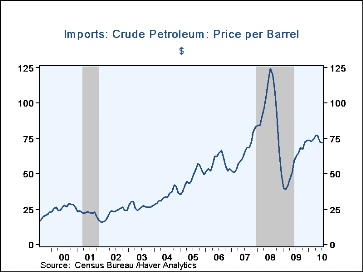
Earlier strength in U.S. imports reversed itself in July as nonoil imports fell 3.0%, though they're still up roughly one-quarter y/y. Imports of nonauto consumer goods fell 4.4% (+15.8% y/y) while auto imports fell 3.4% (45.6% y/y). Capital goods imports fell a lesser 1.5% (+23.8% y/y) following five months of strong gain. The value of all energy-related petroleum continued to rise, last month by 1.5% (20.2% y/y). Also, petroleum import volumes rose 3.4% y/y. The per barrel cost of crude petroleum slipped to $72.09 (+15.5% y/y). Imports of services slipped 0.1% (+8.0% y/y) though travel imports rose 3.3% y/y. Passenger fares increased 1.0% and 13.3% y/y. Other private services imports including education services, financial services, insurance premiums and losses, telecommunications services and business, professional & technical services rose 4.2% y/y.
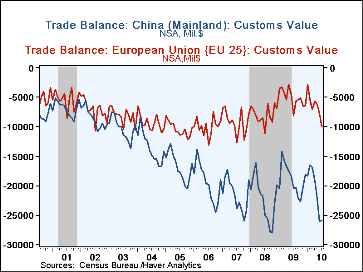
By country, the trade deficit with mainland China improved slightly to $25.9B but remained near its deepest since October 2008. Trade with China surged as exports jumped 39.4% y/y and imports rose almost one-third. The trade deficit with Japan eased to $4.9B but remained near its deepest since December 2008. Imports rose by one-quarter y/y with U.S. economic recovery and exports also rose by one-quarter. With the European Union, the trade deficit deepened sharply to $9.9B, its largest in two years as imports increased 12.9% y/y but exports rose a lesser 9.8%.
The international trade data can be found in Haver's USECON database. Detailed figures are available in the USINT database.
| Foreign Trade | July | June | May | Y/Y | 2009 | 2008 | 2007 |
|---|---|---|---|---|---|---|---|
| U.S. Trade Deficit | $42.8B | $49.8B | $41.8 | $33.1B (7/09) | $374.9B | $698.8B | $702.1B |
| Exports-Goods & Services (m/m) | 1.8% | -1.3% | 2.5% | 18.3% | -14.6% | 11.5% | 13.5% |
| Imports-Goods & Services | -2.1 | 3.1 | 2.9 | 20.5 | -23.3 | 8.0 | 6.3 |
| Petroleum | 0.1 | -3.0 | -9.0 | 20.0 | -44.0 | 37.0 | 9.4 |
| Nonpetroleum | -3.0 | 4.6 | 6.1 | 23.7 | -20.9 | 1.5 | 4.8 |
Tom Moeller
AuthorMore in Author Profile »Prior to joining Haver Analytics in 2000, Mr. Moeller worked as the Economist at Chancellor Capital Management from 1985 to 1999. There, he developed comprehensive economic forecasts and interpreted economic data for equity and fixed income portfolio managers. Also at Chancellor, Mr. Moeller worked as an equity analyst and was responsible for researching and rating companies in the economically sensitive automobile and housing industries for investment in Chancellor’s equity portfolio. Prior to joining Chancellor, Mr. Moeller was an Economist at Citibank from 1979 to 1984. He also analyzed pricing behavior in the metals industry for the Council on Wage and Price Stability in Washington, D.C. In 1999, Mr. Moeller received the award for most accurate forecast from the Forecasters' Club of New York. From 1990 to 1992 he was President of the New York Association for Business Economists. Mr. Moeller earned an M.B.A. in Finance from Fordham University, where he graduated in 1987. He holds a Bachelor of Arts in Economics from George Washington University.
More Economy in Brief
 Global| Feb 05 2026
Charts of the Week: Balanced Policy, Resilient Data and AI Narratives
by:Andrew Cates


