 Global| Feb 12 2019
U.S. JOLTS: Finding Workers to Fill Job Openings Gets Harder
by:Tom Moeller
|in:Economy in Brief
Summary
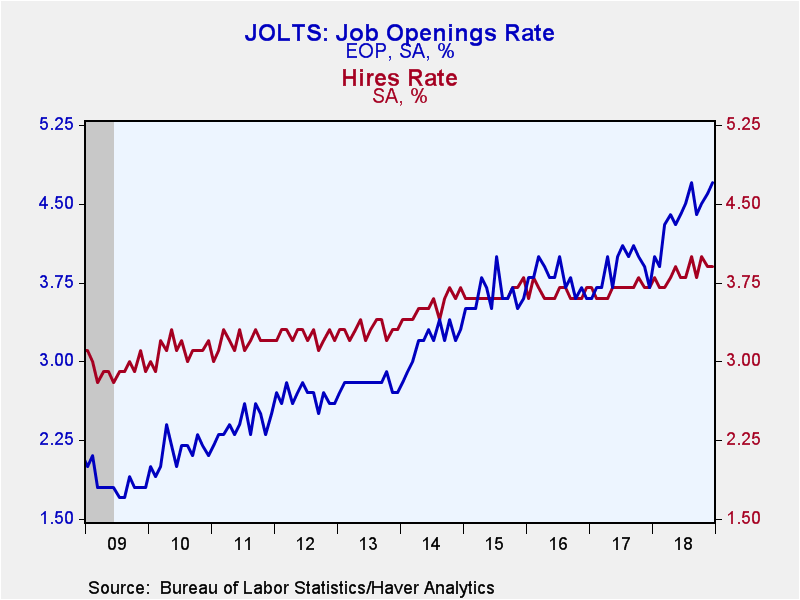
The Bureau of Labor Statistics reported that the total job openings rate increased to 4.7% during December and matched the record high. The job openings rate is the job openings level as a percent of total employment plus the job [...]
The Bureau of Labor Statistics reported that the total job openings rate increased to 4.7% during December and matched the record high. The job openings rate is the job openings level as a percent of total employment plus the job openings level. Finding workers to fill those openings, however, remained difficult. The hiring rate held steady at a strong 3.9%, but it remained beneath the openings rate as it has since early-2017. In this tight labor market, employers remain hesitant to let people go. The layoff & discharge rate dropped to 1.2%, about where it's been for two years. And with jobs plentiful, workers seem ready to seek out new positions. The quits rate held steady at a near-record 2.3%. The JOLTS data begin in 2000.
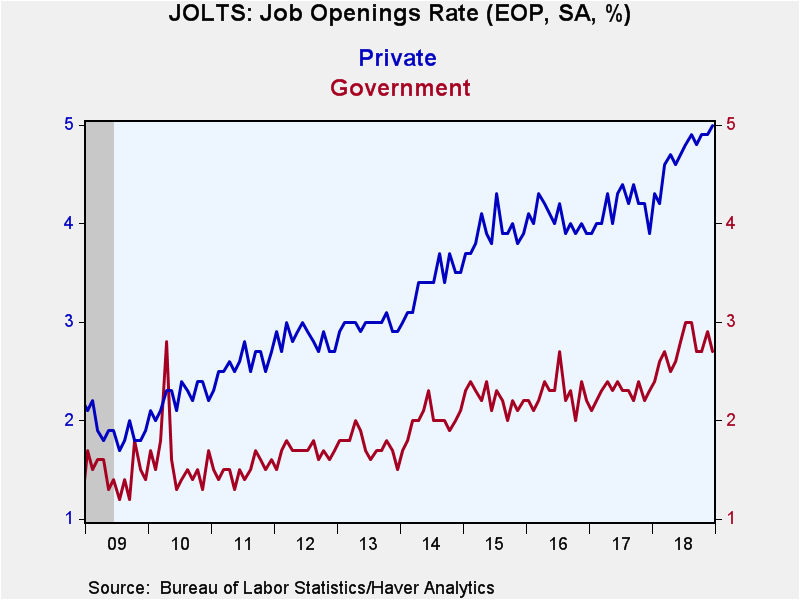
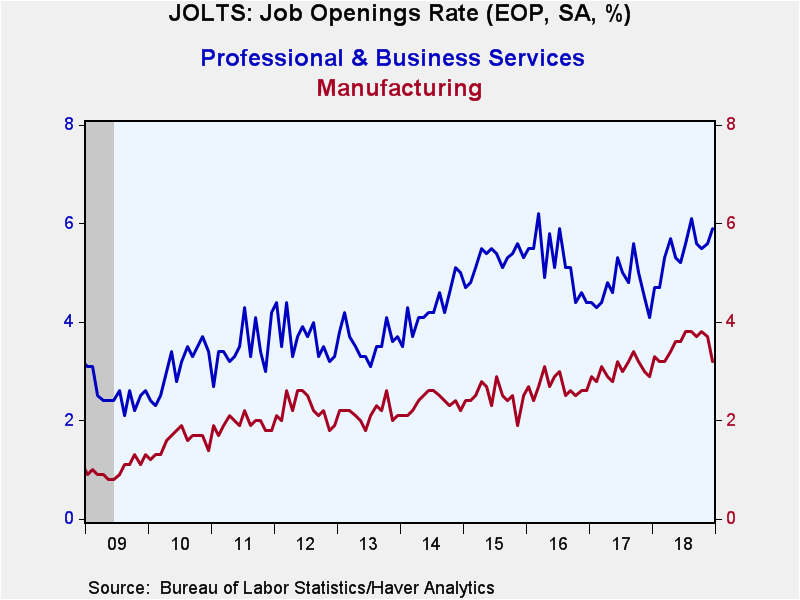
The private-sector job openings rate increased to a record 5.0%. In leisure & hospitality, the rate surged to 6.5%. In professional & business services, it rose to 5.9%, up from 4.1% twelve months earlier. In education & health services, the rate strengthened to 5.2% and approached the record high, but in trade, transportation & utilities, it eased to a still-strong 4.6%. The rate surged to a record 4.9% in construction, but in manufacturing, it fell sharply to 3.2% from a near-record high. The job openings rate in government declined m/m to 2.7%, but remained up sharply versus the 2009 low of 1.2%.
The level of job openings increased 2.4% in December and were up roughly one-quarter y/y at 7.335 million. Private-sector openings increased 3.0% m/m and were up by nearly one-third y/y. Construction sector job availability more than doubled y/y. Job openings in professional business services rose by roughly one-half y/y, and they rose by one-quarter y/y in leisure & hospitality. Openings in leisure & hospitality strengthened by roughly one-quarter y/y and rose to roughly the same degree y/y in education & health services. Trade, transportation & utilities job openings also increased by one-quarter y/y, and in the factory sector, openings gained 14.4% y/y. Government sector job openings rose 19.4% y/y.
The private-sector hiring rate held at 4.3%, but remained just below August's eleven-year high of 4.4%. The rate in leisure & hospitality was unchanged at 6.6%. In professional & business services it rose to 5.5%, but remained below the 5.9% August high. The construction sector's hiring rate held steady at 5.2%, but remained down from the January 2017 high of 5.8%. The hiring rate in trade, transportation & utilities jumped to a near record 4.5%, up sharply from last year's low of 3.6%. In education & health services, the rate surged to a record 3.4%. In manufacturing, the rate declined to a still-firm 2.7%. The hiring rate in government was steady at 1.6%.
Total hiring increased 7.1% y/y to a near-record 5.907 million. Hiring in the private sector rose 7.4% y/y with trade, transportation & utilities hiring strengthening 15.8% y/y. Educational & health services hiring jumped by roughly one-quarter y/y and leisure & hospitality improved 6.0% y/y. Construction sector hiring rose 19.6% y/y. Factory-sector hiring increased 1.1% y/y, but professional & business employment declined 3.4% y/y. Government sector hiring rose 2.6% y/y.
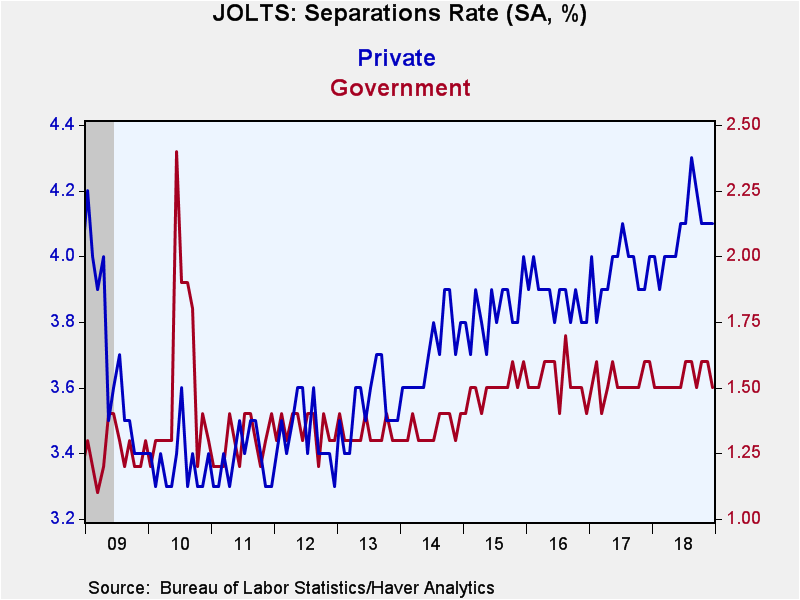
The overall job separations rate eased to 3.7%, but remained near the expansion high. The private sector separations rate slipped to 4.0%, down versus its cycle high of 4.3% reached in August. The separations rate in government held steady at 1.6%.
The level of separations strengthened 4.3% y/y to 5.545 million, though the level has fallen recently. In the private sector, they were up 4.9% y/y led by a 27.1% surge in the construction sector In educational and health services separations rose 18.2% y/y and in trade, transportation & utilities separations separations increased 8.5%. Leisure & hospitality job separations increased 4.6% y/y but in manufacturing, they fell 3.6% y/y. In the financial sector, separations increased 1.2%. Separations in the information sector declined 15.8% y/y and professional & business services job separations decreased 2.5% y/y. Separations in the government sector fell 4.0% y/y.
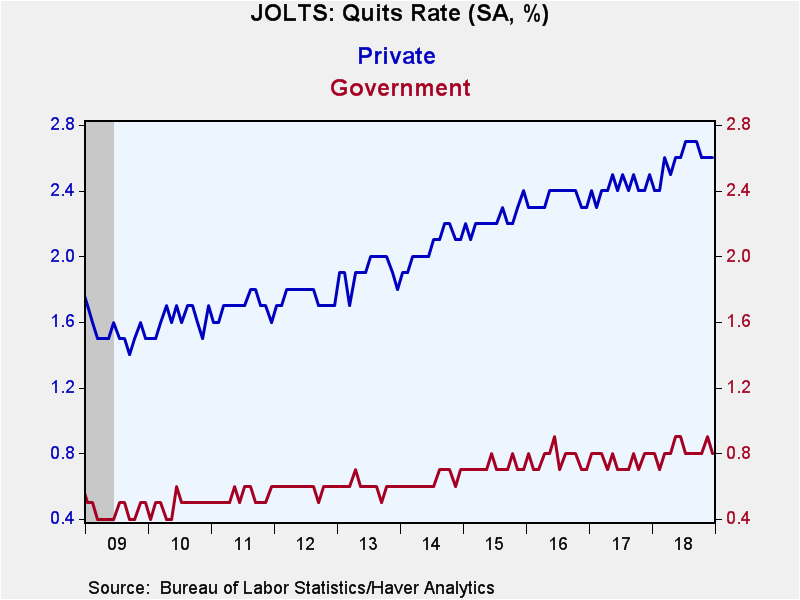
In another sign of a strong labor market, the level of quits rose 4.3% y/y to 3.482 million in December. The quits rate of 2.3% remained up sharply from 1.3% at the beginning of the expansion. The private-sector quits rate held at 2.6%. The rate eased in leisure & hospitality was a strong 4.3% and in professional & business services, the rate increased to 3.2%. In education & health services, the rate increased to 2.3% and in the financial sector it rose to 1.3%. In the factory sector, it fell sharply m/m to 1.5%, but remained higher than the 0.6% 2009 low. The government sector quit rate fell sharply m/m to 0.8%, but still was double the expansion low.
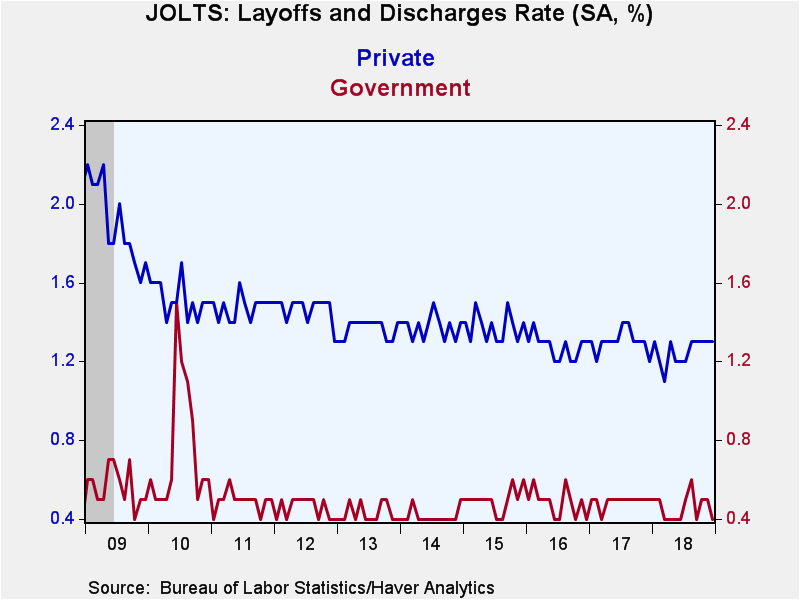
The level of layoffs increased 2.5% y/y to 1.697 million, and the layoff rate eased to a near-record low of 1.1%. In the private sector, the layoff rate held steady at 1.3%, down from the 2009 high of 2.2%. The professional & business services rate held at 1.9%, while in the information sector, it was 0.9%. In leisure & hospitality, the layoff rate remained high at 1.8% and in the factory sector, it was stable at 0.9%. The government sector layoff rate fell to a near-record low 0.4%.
The Job Openings & Labor Turnover Survey (JOLTS) survey dates to December 2000 and the figures are available in Haver's USECON database.
Encouraging Economic Development in High-Poverty Rural Communities is the title of today's speech by Federal Reserve Chairman Jerome H. Powell and it can be found here.
| JOLTS (Job Openings & Labor Turnover Survey, SA) | Dec | Nov | Oct | Dec'17 | Dec'16 | Dec'15 |
|---|---|---|---|---|---|---|
| Job Openings, Total | ||||||
| Rate (%) | 4.7 | 4.6 | 4.5 | 3.7 | 3.6 | 3.6 |
| Total (000s) | 7,335 | 7,166 | 7,131 | 5,669 | 5,490 | 5,396 |
| Hires, Total | ||||||
| Rate (%) | 3.9 | 3.9 | 4.0 | 3.7 | 3.7 | 3.8 |
| Total (000s) | 5,907 | 5,812 | 5,928 | 5,516 | 5,315 | 5,485 |
| Layoffs & Discharges, Total | ||||||
| Rate (%) | 1.1 | 1.2 | 1.2 | 1.1 | 1.2 | 1.2 |
| Total (000s) | 1,697 | 1,753 | 1,761 | 1,655 | 1,682 | 1,759 |
| Quits, Total | ||||||
| Rate (%) | 2.3 | 2.3 | 2.3 | 2.2 | 2.1 | 2.0 |
| Total (000s) | 3,482 | 3,494 | 3,519 | 3,340 | 2,958 | 3,032 |
Tom Moeller
AuthorMore in Author Profile »Prior to joining Haver Analytics in 2000, Mr. Moeller worked as the Economist at Chancellor Capital Management from 1985 to 1999. There, he developed comprehensive economic forecasts and interpreted economic data for equity and fixed income portfolio managers. Also at Chancellor, Mr. Moeller worked as an equity analyst and was responsible for researching and rating companies in the economically sensitive automobile and housing industries for investment in Chancellor’s equity portfolio. Prior to joining Chancellor, Mr. Moeller was an Economist at Citibank from 1979 to 1984. He also analyzed pricing behavior in the metals industry for the Council on Wage and Price Stability in Washington, D.C. In 1999, Mr. Moeller received the award for most accurate forecast from the Forecasters' Club of New York. From 1990 to 1992 he was President of the New York Association for Business Economists. Mr. Moeller earned an M.B.A. in Finance from Fordham University, where he graduated in 1987. He holds a Bachelor of Arts in Economics from George Washington University.
More Economy in Brief
 Global| Feb 05 2026
Charts of the Week: Balanced Policy, Resilient Data and AI Narratives
by:Andrew Cates


