 Global| Jul 02 2004
U.S. Job Growth Took A Breather In June
by:Tom Moeller
|in:Economy in Brief
Summary
Non-farm payrolls rose just 112,000 last month, half the downwardly revised May gain of 235,000. Job growth also fell short of Consensus expectations for a 240,000 rise. Renewed decline in factory sector payrolls accounted for some of [...]
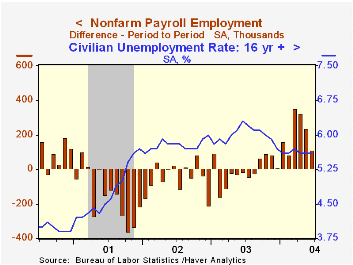
Non-farm payrolls rose just 112,000 last month, half the downwardly revised May gain of 235,000. Job growth also fell short of Consensus expectations for a 240,000 rise.
Renewed decline in factory sector payrolls accounted for some of last month's weakness as they fell 11,000 for the first m/m decline in five. Prior month's gains were downwardly revised. The breadth of hiring in the factory sector fell sharply as indicated by a one-month diffusion index of 45.8% versus readings over 50% during the prior four months.
Hiring in the construction sector also cooled, showing no increase after three months of solid increase (2.9% y/y).
Private service producing payrolls increased just 127,000 (0.1% m/m, 1.6% y/y) following three months of gain between 0.2% and 0.3%. Outright m/m declines were widespread, offset by firm growth in the transportation sector. Temporary help services employment rose 12,100 (0.5% m/m, 10.3% y/y), down sharply from recent rates of gain.
The breadth of increase amongst private non-farm payrolls fell to 57.0% versus 64.6% in May. That pulled the three-month diffusion index down to 66.4% from 74.8%.
The index of aggregate hours worked (employment times hours worked) fell 0.6% following an upwardly revised 0.7% May gain. For 2Q, aggregate hours rose at a 2.0% annual rate versus 1Q which rose at a 2.3% rate from 4Q03.
Average hourly earnings rose just 0.1% following 0.3% increases in the prior two months. The slowdown reflected slower gains in service industries. Factory sector earnings rose 0.2% (2.5% y/y) following an upwardly revised no-change in May.
From the separate household survey the unemployment rate held steady at an expected 5.6%. Employment rose for the third consecutive month, up 259,000 (1.0% y/y). The labor force grew 305,000 (+0.2% y/y). The labor force participation rate ticked slightly higher to 66.0% following four months at 5.9%.
| Employment | June | May | Y/Y | 2003 | 2002 | 2001 |
|---|---|---|---|---|---|---|
| Payroll Employment | 112,000 | 235,000 | 1.1% | -0.3% | -1.1% | 0.0% |
| Manufacturing | -11,000 | 24,000 | -0.9% | -4.8% | -7.2% | -4.8% |
| Average Weekly Hours | 33.6 | 33.8 | 33.7 | 33.7 | 33.8 | 34.0 |
| Average Hourly Earnings | 0.1% | 0.3% | 2.0% | 2.7% | 2.9% | 3.8% |
| Unemployment Rate | 5.6% | 5.6% | 6.3% | 6.0% | 5.8% | 4.8% |
by Tom Moeller July 2, 2004
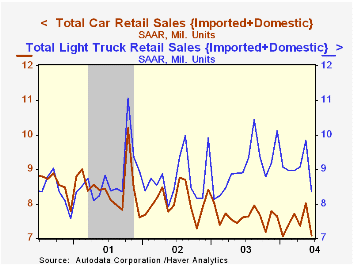
Unit sales of light vehicles gave back all of the gain in May and fell 13.4% last month to the lowest level since December 2000. Sales of 15.44M (-6.5% y/y) compared to Consensus expectations for sales of 16.8M.
Sales of light trucks flopped 14.8% to 8.37M. Car sales fell 11.7% to 7.08M.
The weakness in truck sales pulled sales of domestic light vehicles 15.0% lower to 12.13M (-8.0% y/y). Imported vehicle sales faired somewhat better with only a 7.1% m/m decline to 3.31M (-0.1% y/y). (US sales of light trucks totaled 7.84M last year while imported truck sales totaled 1.20M.)
Imports' share of the US market for new vehicles in June surged to 21.5%, the highest since 1991.
| Light Vehicle Sales (SAAR, Mil.Units) | June | May | Y/Y | 2003 | 2002 | 2001 |
|---|---|---|---|---|---|---|
| Total | 15.44 | 17.84 | -6.5% | 16.69 | 16.81 | 17.26 |
| Autos | 7.08 | 8.01 | -6.9% | 7.63 | 8.07 | 8.48 |
| Trucks | 8.37 | 9.82 | -6.1% | 9.06 | 8.74 | 8.78 |
by Tom Moeller July 2, 2004
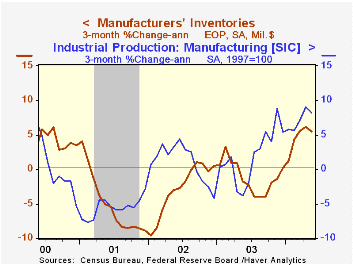
Factory inventories rose 0.5% last month and the increase pulled the y/y comparison to its strongest in three years.
Factory orders slipped a less than expected 0.3% following a 1.1% drop in April. Durable goods orders fell 1.8%, revised from the advance report of a 1.6% drop.
Non-durable goods orders (which equal shipments) rose 1.5% (13.0% y/y) due to across the board strength.
Factory shipments rose 0.3%. Excluding the transportation sector shipments rose 0.4% (13.0% y/y).
| Factory Survey (NAICS) | May | April | Y/Y | 2003 | 2002 | 2001 |
|---|---|---|---|---|---|---|
| Inventories | 0.5% | 0.5% | 1.1% | -1.3% | -1.8% | -6.1% |
| New Orders | -0.3% | -1.1% | 12.6% | 3.7% | -1.9% | -6.7% |
| Shipments | 0.3% | -0.1% | 12.2% | 2.6% | -2.0% | -5.4% |
| Unfilled Orders | 0.4% | 0.7% | 7.7% | 4.2% | -6.1% | -5.9% |

Tom Moeller
AuthorMore in Author Profile »Prior to joining Haver Analytics in 2000, Mr. Moeller worked as the Economist at Chancellor Capital Management from 1985 to 1999. There, he developed comprehensive economic forecasts and interpreted economic data for equity and fixed income portfolio managers. Also at Chancellor, Mr. Moeller worked as an equity analyst and was responsible for researching and rating companies in the economically sensitive automobile and housing industries for investment in Chancellor’s equity portfolio. Prior to joining Chancellor, Mr. Moeller was an Economist at Citibank from 1979 to 1984. He also analyzed pricing behavior in the metals industry for the Council on Wage and Price Stability in Washington, D.C. In 1999, Mr. Moeller received the award for most accurate forecast from the Forecasters' Club of New York. From 1990 to 1992 he was President of the New York Association for Business Economists. Mr. Moeller earned an M.B.A. in Finance from Fordham University, where he graduated in 1987. He holds a Bachelor of Arts in Economics from George Washington University.
More Economy in Brief


