 Global| Jun 03 2005
U.S. Job Gain Well Short of Expectations
by:Tom Moeller
|in:Economy in Brief
Summary
Non-farm payrolls increased just 78,000 in May, the weakest rise since 2003. The prior month's strong gain was revised slightly higher but March was revised lower. Consensus expectations had been for a 180,000 May increase. Widespread [...]
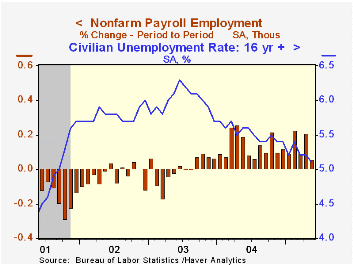
Non-farm payrolls increased just 78,000 in May, the weakest rise since 2003. The prior month's strong gain was revised slightly higher but March was revised lower. Consensus expectations had been for a 180,000 May increase.
Widespread declines in private service producing industries where payrolls rose 59,000 (1.9% y/y) last month accounted for the weakness. Information services jobs fell 8,000 (-0.2% y/y), real estate & leasing jobs were off 1,700 (+2.4% y/y), temporary services jobs fell 4,300 (+5.3% y/y) and jobs in leisure industries fell 6,000 (+2.0% y/y).
Factory sector payrolls fell 7,000 for the fourth monthly decline this year. A 10,000 worker decline in nondurable goods industries (-1.5% y/y) centered in the apparel and the paper industries.
Construction jobs rose 20,000 (4.0% y/y) but that was less than half the prior month's increase. Total government employment rose a modest 5,000 (0.8% y/y). Federal government jobs increased 1,000 (-0.4% y/y) and local gov't employment rose 5,000 (0.8% y/y). 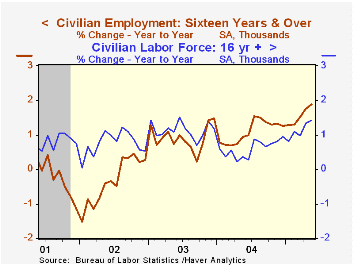
The household survey indicated that the unemployment rate fell unexpectedly to 5.1%, the lowest level since 2001. Employment again was strong posting a 376,000 (1.9% y/y) rise and the labor force rose 360,000 (1.4% y/y). The labor force participation rate moved higher for the second month to 66.1% as the number of dropouts from the force fell for the second month. Growth in dropouts fell to 0.8% y/y, down from the high of 3.7% late in 2003.
The index of aggregate hours worked (employment times hours worked) rose a slight 0.1% (2.3% y/y) and the gain in April was scaled back to 0.6% due to a downward revision to the length of the workweek. The level of hours worked so far in 2Q is up 3.4% (AR) from 1Q05.
The increase in average hourly earnings slowed to 0.2% though earnings in manufacturing rose a strong 0.4% (2.7% y/y).
What's Driving Wage Inequality? The Effects of Technical Change on the Labor Market from the Federal Reserve Bank of Richmond can be found here.
| Employment | May | April | Y/Y | 2004 | 2003 | 2002 |
|---|---|---|---|---|---|---|
| Payroll Employment | 78,000 | 274,000 | 1.5% | 1.1% | -0.3% | -1.1% |
| Manufacturing | -7,000 | -9,000 | -0.3% | -1.2% | -4.9% | -7.2% |
| Average Weekly Hours | 33.8 | 33.8 | 33.8 | 33.7 | 33.7 | 33.8 |
| Average Hourly Earnings | 0.2% | 0.3% | 2.6% | 2.1% | 2.7% | 2.9% |
| Unemployment Rate | 5.1% | 5.2% | 5.6% | 5.5% | 6.0% | 5.8% |
by Tom Moeller June 3, 2005
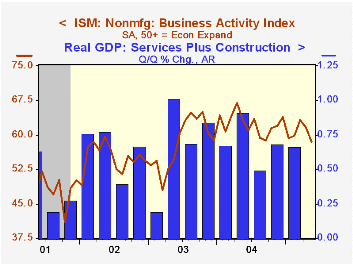
The May Business Activity Index for the non-manufacturing sector fell to 58.5 from 61.7 in April, reported the Institute for Supply Management. The average level so far this year of 60.5 is below the 2004 average of 62.4. Consensus expectations had been for a reading of 60.0 for May.
Since the series' inception in 1997 there has been a 50% correlation between the Business Activity Index and the q/q change in real GDP for services plus construction.
Both the new orders index and the employment indexes rose slightly m/m but remained well off the earlier highs. Since the series' inception in 1997 there has been a 60% correlation between the level of the ISM non-manufacturing employment index and the m/m change in payroll employment in the service producing plus the construction industries.
Pricing power dropped again m/m to the lowest level since August 2003.
ISM surveys more than 370 purchasing managers in more than 62 industries including construction, law firms, hospitals, government and retailers. The non-manufacturing survey dates only to July 1997, therefore its seasonal adjustment should be viewed tentatively.Business Activity Index for the non-manufacturing sector reflects a question separate from the subgroups mentioned above. In contrast, the NAPM manufacturing sector composite index is a weighted average five components.
| ISM Nonmanufacturing Survey | May | April | May '04 | 2004 | 2003 | 2002 |
|---|---|---|---|---|---|---|
| Business Activity Index | 58.5 | 61.7 | 63.3 | 62.4 | 58.2 | 55.1 |
| Prices Index | 57.9 | 61.9 | 72.0 | 69.0 | 56.8 | 54.0 |
by Carol Stone June 3, 2005
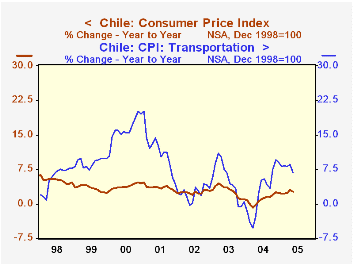
Consumer prices in Chile slowed last month after a strong rise in April. The total CPI was up 0.4% (seasonally adjusted by Haver) following 0.7%. This helped the 12-month inflation rate ease to 2.7% from 2.9%. Energy prices were evidently the main mover in both the April surge and the May moderation; transportation prices had risen a mere 0.2% in March, but leaped 2.2% in April and were still strong but less so in May with a 1.3% rise.
Chilean inflation generally remains well under control. Excluding food and energy, the CPI was up 2.4% over May 2004. This is a higher rate than what prevailed over the previous three years by about 0.7 percentage point. But the firming has come mainly from reduced rates of deflation in clothing prices and home furnishings, not from a measurable reacceleration of some sector; indeed, housing costs, health care and education are basically trendless near the overall inflation rate.
Inflation in Chile also remains notable relative to its neighbors. Argentina still struggles with more than 8% and Brazil with about 7%. Among South American countries, only Ecuador and Peru have slower inflation than Chile. For Ecuador, the slower pace is new just in the last three or four years. Peru's inflation has been a bit lower than Chile's since early 2001, but Peru was experiencing much more dramatic rates until well into the mid-1990s.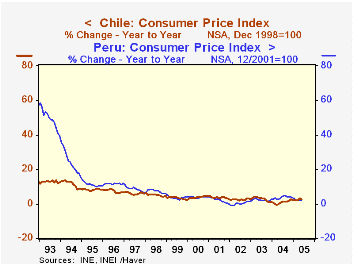
| May 2005 | Apr 2005 | Mar 2005 | Year/ Year | December/December||||
|---|---|---|---|---|---|---|---|
| 2004 | 2003 | 2002 | |||||
| Total CPI | 0.4 | 0.7 | 0.3 | 2.7 | 2.4 | 1.1 | 2.8 |
| ex Food & Energy | 0.5 | 0.3 | 0.1 | 2.4 | 1.8 | 1.6 | 1.8 |
| Food | 0.2 | 0.2 | 0.2 | 1.8 | 0.2 | -0.8 | 3.5 |
| Transportation | 1.3 | 2.2 | 0.2 | 6.7 | 9.1 | 0.3 | 3.5 |

Tom Moeller
AuthorMore in Author Profile »Prior to joining Haver Analytics in 2000, Mr. Moeller worked as the Economist at Chancellor Capital Management from 1985 to 1999. There, he developed comprehensive economic forecasts and interpreted economic data for equity and fixed income portfolio managers. Also at Chancellor, Mr. Moeller worked as an equity analyst and was responsible for researching and rating companies in the economically sensitive automobile and housing industries for investment in Chancellor’s equity portfolio. Prior to joining Chancellor, Mr. Moeller was an Economist at Citibank from 1979 to 1984. He also analyzed pricing behavior in the metals industry for the Council on Wage and Price Stability in Washington, D.C. In 1999, Mr. Moeller received the award for most accurate forecast from the Forecasters' Club of New York. From 1990 to 1992 he was President of the New York Association for Business Economists. Mr. Moeller earned an M.B.A. in Finance from Fordham University, where he graduated in 1987. He holds a Bachelor of Arts in Economics from George Washington University.
More Economy in Brief


