 Global| May 20 2010
U.S. Initial Jobless InsuranceClaims Rise Unexpectedly
by:Tom Moeller
|in:Economy in Brief
Summary
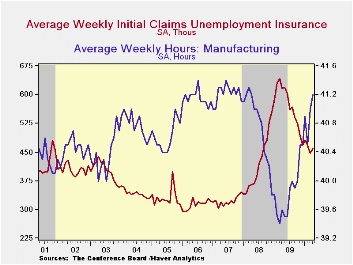
For last week, the Bureau of Labor Statistics reported that initial claims for jobless insurance rose 25,000 to 471,000 following declines during the prior five weeks. The latest disappointed Consensus expectations for 440,000 claims. [...]
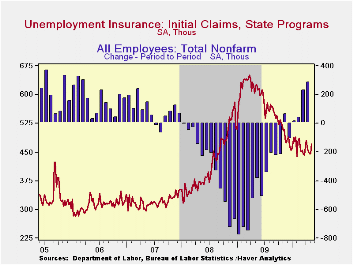
For last week, the Bureau of Labor Statistics reported that initial claims for jobless insurance rose 25,000 to 471,000 following declines during the prior five weeks. The latest disappointed Consensus expectations for 440,000 claims. Even the earlier week's level was revised up modestly. Still, claims remained near this cycle's lowest. Last week's figure was down from the recession peak of 651,000 reached in March of 2009. The four-week moving average of initial claims increased slightly to 453,500.
The latest claims figure covers the survey week for May nonfarm payrolls. Claims fell 7,500 (-1.6%) from the April survey period. During the last ten years there has been an 80% correlation (inverse) between the level of initial claims and the m/m change in nonfarm payrolls.
A 40,000 decline in continuing claims for unemployment insurance during the latest week reversed the prior week's increase. Claims were down by one-third from the June '09 peak. The overall decline is a function of the improved job market but also reflects the exhaustion of 26 weeks of unemployment benefits. Continuing claims provide an indication of workers' ability to find employment. The four-week average of continuing claims at 4.643M remained near the cycle low. This series dates back to 1966.
Extended benefits for unemployment insurance rose w/w to 240,260. However, they were down by three-quarters from a peak of 597,688 reached in November.
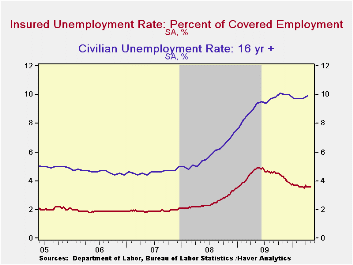
The insured unemployment rate remained at 3.6% where it has been since mid-February. The rate reached a high of 4.9% during May of 2009. During the last ten years, there has been a 96% correlation between the level of the insured unemployment rate and the overall rate of unemployment published by the Bureau of Labor Statistics.
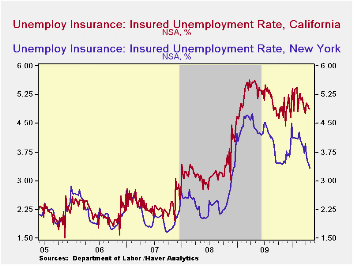
The highest insured unemployment rates in the week ending May 1 were in Alaska (6.4%), Puerto Rico (6.0), Oregon (5.6), Nevada (5.0), California (4.9), Pennsylvania (4.6), Wisconsin (4.6), Montana (4.5), Idaho (4.4), North Carolina (4.4), and Washington (4.4). The lowest insured unemployment rates were in Virginia (1.7), Texas (2.2), Georgia (2.8), Maryland (2.9), Wyoming (3.0), Florida (3.1), Ohio (3.1), New York (3.3) and Maine (3.4). These data are not seasonally adjusted but the overall insured unemployment rate is.
The unemployment insurance claims data is available in Haver's WEEKLY database and the state data is in the REGIONW database.
The impact of low-skilled immigration on the youth labor market from the Board of Governors can be found here here.
| Unemployment Insurance (000s) | 05/15/10 | 05/08/10 | 05/01/10 | Y/Y | 2009 | 2008 | 2007 |
|---|---|---|---|---|---|---|---|
| Initial Claims | 471 | 446 | 446 | -24.6% | 572 | 419 | 321 |
| Continuing Claims | -- | 4,625 | 4,665 | -28.3 | 5,809 | 3,340 | 2,549 |
| Insured Unemployment Rate (%) | -- | 3.6 | 3.6 | 4.9 (5/2009) | 4.4 | 2.5 | 1.9 |
by Robert Brusca May 20, 2010
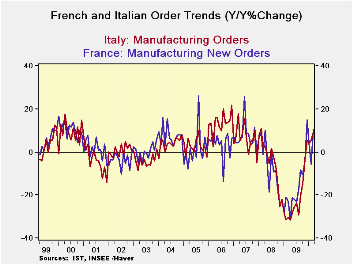
Orders growth has recovered substantially in Germany and in France. Despite the recovery in orders, with the rebounding rates of orders growth, the level of orders is still some 20% to 30% below their respective cycle highs for France and Italy.
Germany posted some very strong orders. France and Italy, too, have posted some degree of orders strength in March. While France’s jump of 6.5% in one month seems very impressive (better than a 100% annual rate) orders in France still are rebounding from a 10.9% drop in January. As a result French orders are still falling on balance over three-months even with this strong monthly rebound. So are orders in Italy.
Europe is certainly due for some kick to growth as the euro has fallen over the past year and plunged sharply over the past few months. But the persisting weakness in European stocks speaks to a loss of confidence. In part the Greek stimulus plan is not fully funded and is awaiting some final votes from Germany to disburse funds. In part it is the still uncooperative tone in Greece where further strikes are planned to protest austerity. In part it is due to concern that, despite all the reluctance to obey the rule of austerity, the fiscal consolidation will prove to be too great to allow European growth to press ahead.
It is these two conflicting ideas that are driving markets into a frenzy, even though they are at odds with each other. Which is it? Are countries going to avoid austerity and not do the right thing? Or, are countries going to be so virtuous with fiscal controls that consolidation will prove to be a load too-heavy and cause growth to be set back? Or is there a middle ground with a more positive result? We have seen recent improvements in the US and European economic reports. Reports with expectations components have shown some of the weakest recent readings. Barometers of current activity have been strong, especially in the UK just outside the Euro-Area
I think we are in a region of political economic uncertainty. Markets are not happy with the stewardship of our political or economic direction in recent years. The private sector has failed us too. It is no wonder that markets feel like taking no prisoners. But it’s also true that at the end of the day the markets know that stock indices have come a long way from their recession bottoms, that interest rates had crept up and are now lower as a result of this sell-off, that central banks are not eager to tighten but are planning to discharge their responsibilities, that – at the end of the day- inflation has remained under wraps. The blow-off in commodity prices that had run well ahead of reality is a welcome event (unless you were long, of course). As we go over the final technical hurdles to get money to Greece (and to thereby protect exposed German and French banks with Greek paper on their balance sheets) we can expect things to settle down and for markets to pay attention of fundamentals again. It’s not just pabulum from a policymaker looking to calm markets. It’s true. The fundamentals are good. Even with the high debt-to-GDP levels the problems are tractable.
| Italy Orders | ||||||
|---|---|---|---|---|---|---|
| Saar exept m/m | Mar-10 | Feb-10 | Jan-10 | 3-mo | 6-mo | 12-mo |
| Total | 1.0% | -0.4% | -2.8% | -8.7% | 12.7% | 9.1% |
| Foreign | 1.8% | -0.5% | -2.3% | -4.1% | 22.0% | 21.4% |
| Domestic | 0.4% | -0.2% | -3.1% | -11.1% | 7.7% | 3.0% |
| Memo | ||||||
| Sales | 1.5% | -2.6% | 2.6% | 6.2% | 8.3% | 6.3% |
| French Orders | ||||||
| Saar exept m/m | Mar-10 | Feb-10 | Jan-10 | 3-mo | 6-mo | 12-mo |
| Total | 6.5% | -1.0% | -10.9% | -22.4% | 2.2% | 10.6% |
| Foreign | 2.9% | 1.0% | -8.7% | -19.1% | 26.7% | 28.9% |
| IP xConstruct | 0.8% | 0.3% | 0.6% | 7.0% | 3.7% | 6.7% |
by Tom Moeller May 20,2010
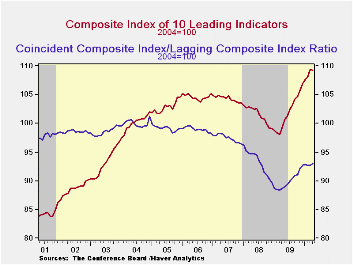
Following twelve consecutive monthly increases, the Conference Board's Index of Leading Economic Indicators declined during April. The index slipped 0.1% after a downwardly revised 1.3% March gain. The three-month rate of increase also slipped to 6.5% (AR), its weakest in roughly one year. The leading index is based on actual reports for eight economic data series. The Conference Board initially estimates two series, consumer and capital goods orders.
The breadth of increase amongst the component leading series fell to its lowest since March of last year. Prominent in last month's index decline were lower building permits, quicker vendor performance, lower money supply growth and higher initial claims for unemployment insurance. Just four of the ten components rose. These included higher capital goods orders, a steeper interest rate yield curve, higher stock prices and a longer workweek.
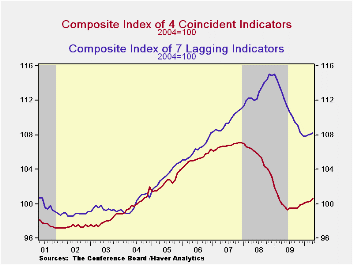
The index of coincident indicators rose 0.3%, the strongest monthly gain since November. The three-month change of 2.0% was near its high of late last year. Increases in all four of the component series including industrial production, real personal income, business sales and payroll employment contributed to last month's increase.
The lagging index rose slightly for the third month since January 2009. Higher C&I loans accounted for most of the increase. The ratio of coincident-to-lagging indicators (another leading indicator) rose slightly to the highest level since July, 2008.
The Conference Board figures are available in Haver's BCI database. Visit the Conference Board's site for coverage of leading indicator series from around the world. The latest U.S. Leading Indicators release can be found here.
| Business Cycle Indicators (%) | April | March | February | Dec. 6-Month % (AR) | 2009 | 2008 | 2007 |
|---|---|---|---|---|---|---|---|
| Leading | -0.1 | 1.3 | 0.4 | 10.6 | 0.5 | -2.7 | -0.2 |
| Coincident | 0.3 | 0.1 | 0.1 | 1.4 | -5.1 | -1.2 | 1.4 |
| Lagging | 0.1 | 0.1 | 0.2 | -2.9 | -1.6 | 3.2 | 3.0 |
by Tom MoellerMay 20, 2010
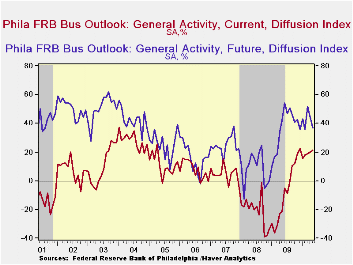
The economic recovery continued this month according to the Philadelphia Federal Reserve Bank. It indicated that its May index of regional factory sector activity rose for the fourth consecutive month to the second highest level since early-2005. At 21.4 the index roughly matched Consensus expectations and has been positive since the summer. The latest figure compared to those near -40.0 at the recent recession's weakest.
During the last ten years there has been a 75% correlation between the level of the Philadelphia Fed Business Conditions Index and the three-month growth in factory sector industrial production. There has been a 73% correlation with q/q growth in real GDP. The latest survey from the Philadelphia Federal Reserve Bank can be found here.
Improved shipments powered the June index gain. It was accompanied by higher new orders. Factory payrolls, however, eased but still showed net-hiring for the sixth straight month. During the last ten years, there has been a 90% correlation between the index level and the three-month change in manufacturing sector payrolls.
The prices paid index slipped from the recent high. During the last ten years there has been a 66% correlation between the prices paid index and the three-month growth in the intermediate goods PPI. There has been an 77% correlation with the change in core intermediate goods prices.
The separate index of expected business conditions in six months also fell, to the lowest level since April of last year. Expected prices paid also fell to the lowest level since last August. Expected capital expenditures also fell m/m and were well below the February high.
The figures from the Philadelphia Federal Reserve can be found in Haver's SURVEYS database.
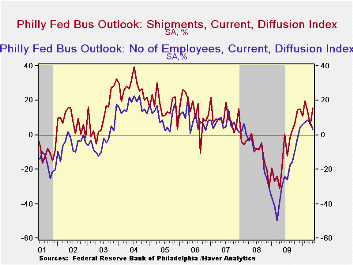
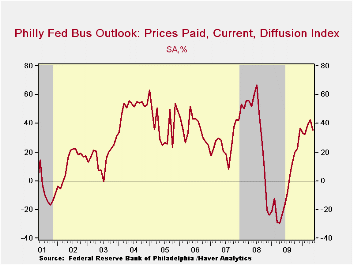
| Philadelphia Fed (%) | May | April | March | May '09 | 2009 | 2008 | 2007 |
|---|---|---|---|---|---|---|---|
| General Activity Index | 21.4 | 20.2 | 18.9 | -21.7 | -7.6 | -21.4 | 5.0 |
| New Orders | 6.1 | 13.9 | 9.3 | -23.2 | -9.7 | -14.7 | 6.9 |
| Shipments | 15.8 | 5.6 | 13.6 | -18.7 | -8.0 | -9.2 | 9.9 |
| Delivery Times | -1.2 | 5.4 | 7.9 | -19.1 | -15.3 | -10.6 | -6.1 |
| Number of Employees | 3.2 | 7.3 | 8.4 | -29.8 | -23.8 | -8.8 | 6.8 |
| Inventories | -7.9 | 2.0 | -11.0 | -27.8 | -24.0 | -16.7 | -3.7 |
| Prices Paid Index | 35.5 | 42.7 | 38.6 | -23.8 | -3.9 | 36.3 | 26.3 |

Tom Moeller
AuthorMore in Author Profile »Prior to joining Haver Analytics in 2000, Mr. Moeller worked as the Economist at Chancellor Capital Management from 1985 to 1999. There, he developed comprehensive economic forecasts and interpreted economic data for equity and fixed income portfolio managers. Also at Chancellor, Mr. Moeller worked as an equity analyst and was responsible for researching and rating companies in the economically sensitive automobile and housing industries for investment in Chancellor’s equity portfolio. Prior to joining Chancellor, Mr. Moeller was an Economist at Citibank from 1979 to 1984. He also analyzed pricing behavior in the metals industry for the Council on Wage and Price Stability in Washington, D.C. In 1999, Mr. Moeller received the award for most accurate forecast from the Forecasters' Club of New York. From 1990 to 1992 he was President of the New York Association for Business Economists. Mr. Moeller earned an M.B.A. in Finance from Fordham University, where he graduated in 1987. He holds a Bachelor of Arts in Economics from George Washington University.
More Economy in Brief


