 Global| Oct 04 2007
U.S. Initial Jobless Insurance Claims Up, Perhaps Rehiring as Well
by:Tom Moeller
|in:Economy in Brief
Summary
During the last week of September, initial claims for unemployment insurance rose 16,000 to 317,000. The latest was the highest level since the first week of last month. The Labor Department indicated that there were no special [...]
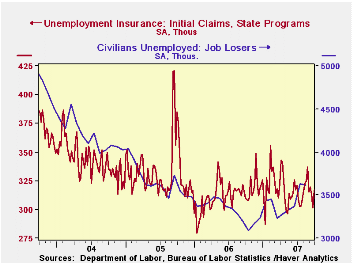
During the last week of September, initial claims for unemployment insurance rose 16,000 to 317,000. The latest was the highest level since the first week of last month. The Labor Department indicated that there were no special factors that distorted these readings.
The gain exceeded expectations for a lesser rise to 310,000 but left the average level of claims last month at 313,000. That was down 10,000 from August.
The trend in initial jobless insurance claims still is down from the August peak level of 325,000. That is suggestive that fewer individuals are losing their jobs, although the accompanying chart from the Labor Department's Household Employment survey indicates a rising layoff rate.
A claims level below 400,000 typically has been associated with growth in nonfarm payrolls. During the last six years there has been a (negative) 78% correlation between the level of initial claims and the m/m change in nonfarm payroll employment.
The four-week moving average of initial claims fell to 312,750 (-0.7% y/y).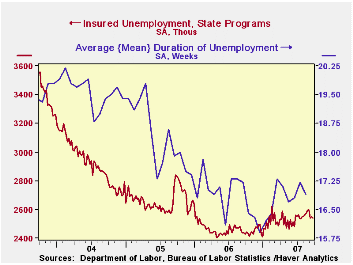
Continuing claims for unemployment insurance fell 10,000 to 2,541 and reversed all of the increase during the prior week. Continuing claims have stabilized at a level off the August peak of 2,597, suggesting that the pace of rehiring may have picked up. That also is suggested by the accompanying chart which shows that the recent rise in the duration of unemployment has stabilized.
The continuing claims numbers lag the initial claims figures by one week.
The insured rate of unemployment was stable at 1.9%, off the peaks in August of 2.0% held for two consecutive weeks at month- end.
Will Monetary Policy Become More of a Science? from Federal Reserve Board Governor Frederic S. Mishkin can be found here.
| Unemployment Insurance (000s) | 09/29/07 | 09/22/07 | Y/Y | 2006 | 2005 | 2004 |
|---|---|---|---|---|---|---|
| Initial Claims | 317 | 301 | 2.3% | 313 | 331 | 343 |
| Continuing Claims | -- | 2,541 | 4.1% | 2,545 | 3.3% | 2,459 |
by Tom Moeller October 4, 2007
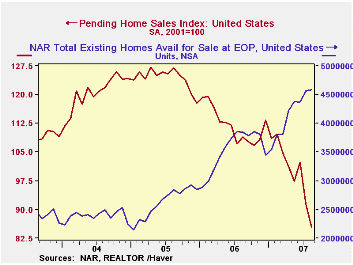
In yet another sign of weakness in the U.S. housing market, the National Association of Realtors indicated that the August level of pending home sales fell 6.5% from July and 21.5% from one year earlier.
The latest monthly figure is 31.2% below the peak average level during 2005. The data date back only to 2001. These are home sales under contract but not yet closed.
In further confirmation of the slow rate of home sales, the Realtors indicated in an earlier report that the number of homes on the market and available for sale rose slightly in August to a level 19.2% above the year earlier level.
In the Western part of the nation, the down trend in pending home sales is most severe with a 27.1% drop.
Despite that relative severity out West, the drop in pending home sales is large and pervasive. In the Northeast, pending home sales are down 19.3%. That decline compares to an 18.0% decline in the Midwest and a 21.3% drop in the South.
The pending home sales data are available in Haver's PREALTOR database and the number of homes on the market are in the REALTOR database.
Whose part is it? Measuring domestic content of vehicles from the Federal Reserve bank of Chicago is available here.
| Pending Home Sales (2001=100) | August | July | Y/Y | 2006 | 2005 | 2004 |
|---|---|---|---|---|---|---|
| Total | 85.5 | 91.4 | -21.5% | 112.1 | 124.2 | 120.5 |
by Carol Stone October 4, 2007
It's widely known that the housing market has been in a deep slump. And it's also said that the impact is not uniform across the country, but is concentrated in a number of select states. Some evidence for that arrived this morning in the form of housing starts data by state.
Ah, but the Census Bureau doesn't produce starts data for states, you argue. Indeed. But the researchers at Bank of Tokyo-Mitsubishi UFJ compile surrogates from the Census Bureau's building permits data and from the starts data for regions and their seasonal factors. The BOT-Mitsubishi series are available in Haver's REGIONAL database. The underlying building permits are in Haver's collection of state, county and metro area PERMITS databases.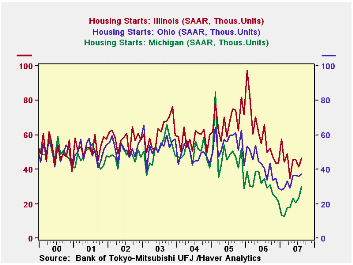
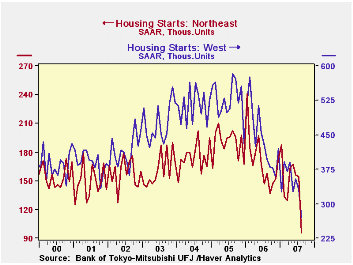
In August, then, total national housing starts fell 36,000 units (SAAR) or 2.6% from July. They are 41.9% below their peak in January 2006. The regions are all quite distinct from the national total and from each other. In the Northeast, the Census data show that starts had moderate erosion until this last month; a 37.8% drop in that one month put them 60.2% below their peak, which was also in January 2006. This is now the biggest decline from peak of any region. In the West, starts fell 18.4% in August; they are now 53.5% below their peak, which occurred back in August 2005. In the other two regions, the South and the Midwest, starts rose in August. In the South, they were up 11.4%, and 4.2% in the Midwest. The South's activity level is 38.1% below its peak in January 2006 and the Midwest's, 44.5% below its peak in February 2005.
It is actually the Midwest that is perhaps most interesting.Recent mortgage delinquency data show a concentration of difficulties in this area, with Michigan and Ohio both experiencing significantly worse performances than most other states. But in both cases, construction of new houses has started to move higher. According to the Bank of Tokyo-Mitsubishi calculations, starts in Michigan, seen in the second graph, have risen from a mere 12,600 (seasonally adjusted annual rate) six months ago to 30,110 in August. This is still quite low by historical comparison, but the climb has been steady and progressive through the spring and summer. In Ohio, starts are up just moderately, but they have remained higher all year long since an apparent trough in January. The bottom in Illinois is more recent, April, but the pattern since then gives signs of stability.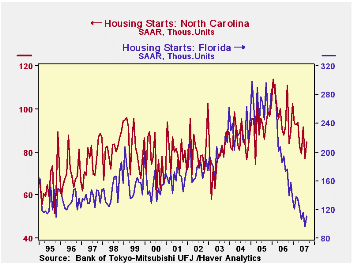
The performances in other states indicate wide divergence. An easy comparison is between the two big Southern states, Florida and North Carolina. Both are well down in the last 18 months or so, but the plunge in Florida housing activity has been far steeper, 62% from a peak in February 2006. North Carolina's starts have held up relatively better, with a 25% decline since January 2006. Both states saw modest increases in August, but their monthly changes are erratic enough to keep us from concluding that there's an outright upturn in the works. The sudden drop in the Northeast occurred in New York, where starts plunged from 62,000 in July to just 29,000 in August; one state in the region saw an increase, New Jersey, but only modestly.
August starts were down in nearly every state in the West. California is perhaps most notable, but others, even those that had been hovering in a narrow range, saw their activity decline in the month. Ironically, one state we've heard a lot about from a mortgage quality standpoint, Nevada, actually saw its housing starts increase, reaching their best level since April. Even so, the pace there, at 23,000 annual rate in August, is still only about half what it was two years before.
| Housing Starts, 000, SAAR | Aug 2007 | July 2007 | June 2007 | Peak | 2006 | 2005 | 2004 |
|---|---|---|---|---|---|---|---|
| Total US | 1,331 | 1,367 | 1,468 | 2,292 (Jan 2006 | 1,801 | 2,068 | 1,956 |
| Northeast | 96 | 154 | 156 | 241 (Jan 2006) | 167 | 190 | 175 |
| Midwest | 248 | 238 | 232 | 446 (Feb 2005) | 28 | 357 | 356 |
| South | 716 | 643 | 726 | 1,156 | 910 | 996 | 908 |
| West | 271 | 332 | 354 | 583 | 444 | 525 | 516 |

Tom Moeller
AuthorMore in Author Profile »Prior to joining Haver Analytics in 2000, Mr. Moeller worked as the Economist at Chancellor Capital Management from 1985 to 1999. There, he developed comprehensive economic forecasts and interpreted economic data for equity and fixed income portfolio managers. Also at Chancellor, Mr. Moeller worked as an equity analyst and was responsible for researching and rating companies in the economically sensitive automobile and housing industries for investment in Chancellor’s equity portfolio. Prior to joining Chancellor, Mr. Moeller was an Economist at Citibank from 1979 to 1984. He also analyzed pricing behavior in the metals industry for the Council on Wage and Price Stability in Washington, D.C. In 1999, Mr. Moeller received the award for most accurate forecast from the Forecasters' Club of New York. From 1990 to 1992 he was President of the New York Association for Business Economists. Mr. Moeller earned an M.B.A. in Finance from Fordham University, where he graduated in 1987. He holds a Bachelor of Arts in Economics from George Washington University.
More Economy in Brief


