 Global| May 13 2010
U.S. Initial Jobless Insurance Claims Slip To Low-End Of Recent Range
by:Tom Moeller
|in:Economy in Brief
Summary
U.S. import prices were raised during the last year by two forces, higher energy prices and the lower dollar. The Bureau of Labor Statistics indicated that last month import prices rose 0.9% in April and roughly matched Consensus [...]
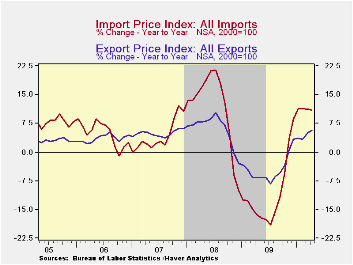
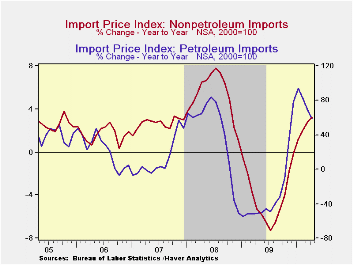
U.S. import prices were raised during the last year by two forces, higher energy prices and the lower dollar. The Bureau of Labor Statistics indicated that last month import prices rose 0.9% in April and roughly matched Consensus expectations for a 0.8% increase. Excluding petroleum, import prices gained 0.3% after easier increases during the prior two months. During the last twelve months, the gain in energy prices remained strong at 58.7% and non-oil import price gains reached a new high of 3.3%.
Petroleum prices rose 3.3% last month, the strongest gain since January. Through April, prices rose 9.3% after last year's 78.6% increase from December to December. That strength faded in May. So far this month, Brent crude oil prices averaged close to $80 per barrel versus $85 last month.
For non-oil imports, prices also have picked up with the lower dollar as well as the firmer economy. Prices rose 0.3% in April following little change during the prior two months. As a result, prices rose at a 2.5% rate since December. That's down from the 6.8% peak reached in January but up from the 4.1% decline last year. (During the last ten years, there has been a negative 81% correlation between the nominal trade-weighted exchange value of the US dollar vs. major currencies and the y/y change in non-oil import prices.)
Despite the macro-forces behind strength in non-oil import prices, the detail showed very limited gains. Stronger food & beverage prices have provided the lift this year with an 11.7% (AR) gain since December. That compares to a 2.8% decline during 2009. Prices for nonauto consumer goods have been under control. The unchanged reading last month capped a 0.6% YTD gain versus a 0.3% decline last year. Apparel prices have been unchanged YTD after a 0.1% decline last year. Furniture prices fell 6.7% YTD after little change last year while appliance prices have strengthened by 4.0% after last year's more modest increase. Imported auto prices fell at a 1.1% rate YTD after a 0.4% uptick last year.Capital goods ticked up 0.1% last month (-1.3% YTD) and excluding computers, prices rose 0.2% (-0.5% YTD) following a 0.7% gain last year.
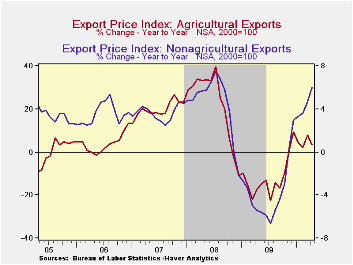
Total export prices rose 1.2% last month after a 0.7% March increase. The rise reflected a 1.4% jump (9.0% YTD) in non-agricultural export prices and a 0.7% drop in agricultural goods prices (-4.3% YTD).
The import and export price series can be found in Haver's USECON database. Detailed figures are available in the USINT database.
| Import/Export Prices (NSA, %) | April | March | February | April Y/Y | 2009 | 2008 | 2007 |
|---|---|---|---|---|---|---|---|
| Import - All Commodities | 0.9 | 0.5 | -0.1 | 11.1 | -11.5 | 11.5 | 4.2 |
| Petroleum | 3.3 | 2.7 | -0.8 | 58.7 | -35.9 | 37.7 | 11.6 |
| Nonpetroleum | 0.3 | -0.1 | 0.1 | 3.3 | -4.1 | 5.3 | 2.7 |
| Export - All Commodities | 1.2 | 0.7 | -0.3 | 5.7 | -4.6 | 6.0 | 4.9 |
by Tom Moeller May 13, 2010
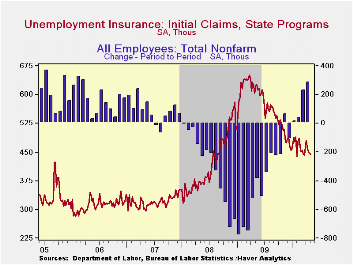
The Bureau of Labor Statistics reported that initial claims for jobless insurance fell 4,000 to 444,000 after the prior week's lessened 3,000 drop. As was the case last week, the latest level remained near this cycle's lowest but disappointed Consensus expectations for 440,000 claims. Last week's figure was down from the recession peak of 651,000 reached in March of 2009. The four-week moving average of initial claims increased slightly to 450,500.
A 12,000 increase in continuing claims for unemployment insurance during the latest week followed a lessened 38,000 drop during the prior week. Claims were down by one-third from the June '09 peak. The overall decline is a function of the improved job market but also reflects the exhaustion of 26 weeks of unemployment benefits. Continuing claims provide an indication of workers' ability to find employment. The four-week average of continuing claims at 4.640M remained near the cycle low. This series dates back to 1966.
Extended benefits for unemployment insurance rose w/w to 218,812. However, they were down by three-quarters from a peak of 597,688 reached in November.
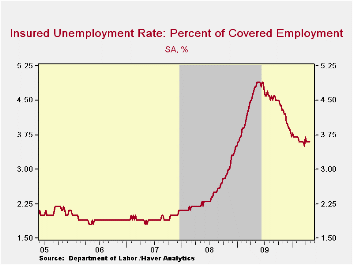
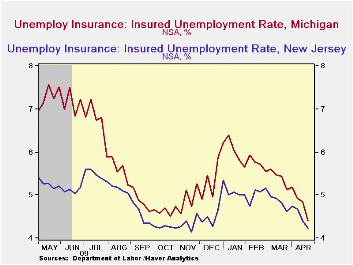
The insured unemployment rate remained at 3.6% where it has been since mid-February. The rate reached a high of 4.9% during May. During the last ten years, there has been a 96% correlation between the level of the insured unemployment rate and the overall rate of unemployment published by the Bureau of Labor Statistics.
The highest insured unemployment rates in the week ending April 24 were in Alaska (6.6 percent), Puerto Rico (6.3), Oregon (5.8), Nevada (5.1), California (4.9), Pennsylvania (4.8), Wisconsin (4.8), Montana (4.7), North Carolina (4.6), Rhode Island (4.6), Connecticut (4.5), and Idaho (4.5). The lowest insured unemployment rates were in Virginia (2.1), Texas (2.2), Georgia (2.8), Wyoming (2.9), Maryland (3.0), Florida (3.1), Ohio (3.2), New York (3.5) and Maine (3.7). These data are not seasonally adjusted but the overall insured unemployment rate is.
The unemployment insurance claims data is available in Haver's WEEKLY database and the state data is in the REGIONW database.
| Unemployment Insurance (000s) | 05/08/10 | 05/01/10 | 04/24/10 | Y/Y | 2009 | 2008 | 2007 |
|---|---|---|---|---|---|---|---|
| Initial Claims | 444 | 448 | 451 | -29.0% | 572 | 419 | 321 |
| Continuing Claims | -- | 4,627 | 4,615 | -27.6% | 5,809 | 3,340 | 2,549 |
| Insured Unemployment Rate (%) | -- | 3.6 | 3.6 | 4.9 (5/2009) | 4.4 | 2.5 | 1.9 |
by Tom Moeller May 13, 2010
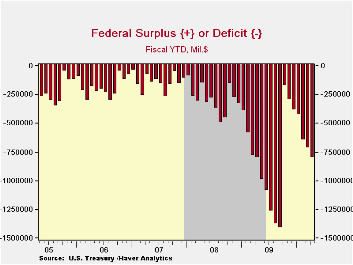
The Federal government's April budget balance totaled $-82.7B which was four times the April '09 deficit. Nevertheless, the Fiscal 'YTD deficit narrowed to $799.7B and was somewhat smaller than the FY'09 deficit of $802.3B.
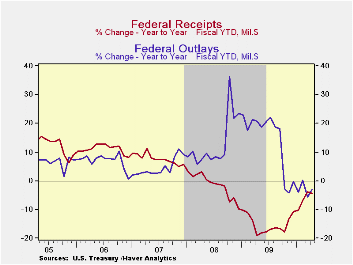
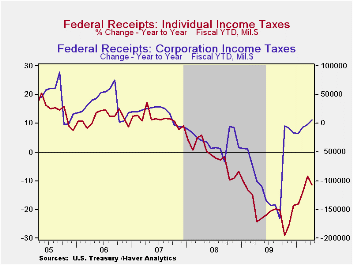
Though the recession ended, net revenues during the first seven months of FY'10 still fell 4.5% y/y. Individual income tax receipts fell 11.6% y/y as the unemployment rate remained elevated. The rate of decline, however, is down from the peak 29.0% at the end of last year. Corporate tax receipts firmed by 8.9% versus the first seven months of last fiscal year with improved corporate profits. Year-to-date, employment taxes fell 4.8% (just lightly off the peak rate of decline) but unemployment insurance tax receipts improved by 12.3% versus the first seven months of last fiscal year. Estate & gift taxes fell by nearly one-quarter this fiscal year.
Overall outlays fell 2.9% so far this fiscal year versus FY'09 as a commerce & housing credit expired. Social Security payments (21% of outlays) rose 6.7% and net interest payments (5% of outlays) rose 7.9% with higher rates. Medicare expenditures (12% of outlays) rose 11.0% and other health care services spending (10% of outlays) rose 12.4%. "Income security" spending (11% of outlays) continued to jump by one-quarter while defense spending (19% of total outlays) rose 7.8%.
The Government's financial data are available in Haver's USECON database, with extensive detail available in the specialized GOVFIN.
True Legislators Becoming Scarce in Congress from the American Enterprise Institute can be found here.
| US Government Finance | April | FY 'YTD | FY 'YTD | FY 2009 | FY 2008 | FY 2007 |
|---|---|---|---|---|---|---|
| Budget Balance | $-82.7B | $-799.7B | -- | $-1,417.1B | $-454.8B | $-161.5B |
| Net Revenues | $245.3B | $1,199.2B | -4.5% | -16.6% | -1.7% | 6.7% |
| Net Outlays | $328.0B | $1,998.8B | -2.9% | 18.2% | 9.1% | 2.8% |
by Robert Brusca May 13, 2010
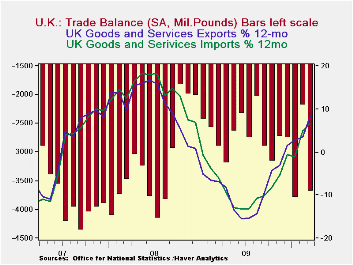
The UK trade picture deteriorated in March With exports up by 1% on the month as imports screamed higher by 5.2%. This put exports in a severe shortfall position for March and ballooned the deficit. Of course in March the situation had been completely reversed and the deficit was much smaller. Over the various intervals in the table, 3-mo, 6-mo and 12-mo, export and import growth rate pairs are very similar in each period (with both growth rates steadily rising). But imports are stronger over three months compared to exports which, in turn, are stronger over six- and twelve-months. But since the UK trade balance is in deficit to start, those periods in which exports did grow faster did not did not do much good, as the deficit widened in each of them (three months compared to six months and six months compared to twelve-months).
The trade balance is a tough to talk about in the recession-to-recovery periods since its impact on the economy and its meaning are conflicted. Obviously a wider trade deficit weakens GDP as the trade balance is a subtraction from GDP. But paradoxically strong imports which contribute to a widening of the deficit (all other things equal) are a sign of revived domestic demand and of STRONGER GDP growth.
So the signal from trade about the UK economy is somewhat muddled. In the chart above the trend for the deficit shows that amid some volatility the deficit is getting larger indicating that imports are outpacing exports or at least more of less tracking with them. More importantly, the growth rate for imports is steadily rising (as is the trend for exports). That suggests a revival in demand in the UK economy. So while the trade gap is widening and that is siphoning off some of the impact of this rising domestic demand, reducing its spur to domestic growth, the evidence from trade is that the UK economy is still in the improving mode as domestic demand is underpinning imports and rising strongly.
| UK Trade trends for goods | |||||
|---|---|---|---|---|---|
| m/m% | % Saar | ||||
| Mar-10 | Feb-10 | 3M | 6M | 12M | |
| Balance* | -£ 52 | -£ 6.31 | -£ 7.26 | -£ 7.14 | -£ 6.87 |
| Exports | |||||
| All Exp | 1.0% | 8.0% | 10.9% | 23.6% | 15.7% |
| Capital gds | 0.8% | 1.3% | 2.4% | 13.1% | -0.4% |
| Road Vehicles | -2.1% | 4.0% | -29.4% | 28.6% | 45.1% |
| Basic Materials | 13.1% | 46.9% | 174.7% | 84.6% | 57.9% |
| Food Feed Bev & Tbco | 0.6% | 8.0% | -0.6% | 15.6% | 10.7% |
| Other Exports | 0.9% | 8.6% | 15.6% | 23.7% | 15.2% |
| IMPORTS | |||||
| All IMP | 5.2% | -0.3% | 16.1% | 21.4% | 14.0% |
| Capital gds | 2.4% | -0.4% | 0.0% | 23.1% | 9.0% |
| Road Vehicles | 8.2% | -1.0% | 5.6% | 30.7% | 60.9% |
| Basic Materials | 10.8% | -3.2% | 73.6% | 22.8% | 24.6% |
| Food Feed Bev & Tbco | 1.8% | 1.9% | -5.0% | 8.6% | 1.7% |
| Other Imports | 5.5% | -0.3% | 22.8% | 21.7% | 11.5% |
| *Stg Blns; mo or period average | |||||
Tom Moeller
AuthorMore in Author Profile »Prior to joining Haver Analytics in 2000, Mr. Moeller worked as the Economist at Chancellor Capital Management from 1985 to 1999. There, he developed comprehensive economic forecasts and interpreted economic data for equity and fixed income portfolio managers. Also at Chancellor, Mr. Moeller worked as an equity analyst and was responsible for researching and rating companies in the economically sensitive automobile and housing industries for investment in Chancellor’s equity portfolio. Prior to joining Chancellor, Mr. Moeller was an Economist at Citibank from 1979 to 1984. He also analyzed pricing behavior in the metals industry for the Council on Wage and Price Stability in Washington, D.C. In 1999, Mr. Moeller received the award for most accurate forecast from the Forecasters' Club of New York. From 1990 to 1992 he was President of the New York Association for Business Economists. Mr. Moeller earned an M.B.A. in Finance from Fordham University, where he graduated in 1987. He holds a Bachelor of Arts in Economics from George Washington University.


