 Global| Jul 10 2008
U.S. Initial Jobless Insurance Claims Dropped With Holiday, Trend Up
by:Tom Moeller
|in:Economy in Brief
Summary
Initial claims for jobless insurance fell sharply last week to 346,000 from an unrevised level of 404,000 during the week prior. The decline outpaced Consensus expectations for a lesser dip to 395,000 claims. It likely reflected the [...]
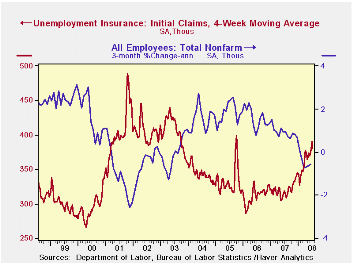
Initial claims for jobless insurance fell sharply last week to 346,000 from an unrevised level of 404,000 during the week prior. The decline outpaced Consensus expectations for a lesser dip to 395,000 claims. It likely reflected the difficulties of seasonal adjustment caused by the timing of the July 4th holiday.
As a result of the decline, the four-week moving average of initial claims fell sharply to 380,500 (20.3% y/y). The trend in claims, however continued up and they averaged 391,000 last month after having averaged 369,000 during May. The numbers have trended up since March when initial claims averaged 375,000.
A claims level below 400,000 typically has been associated
with growth in nonfarm payrolls. During the last ten years there has
been a (negative) 76% correlation between the level of initial claims
and the m/m change in nonfarm payroll employment. Over the longer
period of time, the level of claims for jobless insurance has not
trended higher with the size of the labor force due to a higher
proportion of self-employed workers who are not eligible for benefits.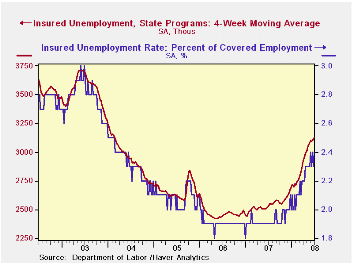
Continuing claims for unemployment insurance surged during the latest week by 91,000 after a little-revised 24,000 decline during the week prior. The rise lifted the four-week average of continuing claims to another cycle high of 3,126,000 which was roughly a quarter higher than a year ago and the highest level since early 2004.
Continuing claims provide some indication of workers' ability to find employment and they lag the initial claims figures by one week.
The insured rate of unemployment returned back to 2.4%, the highest level since early 2004.
Regulatory Restructuring is today's testimony by Fed ChairmanBen S. Bernanke to the Committee on Financial Services, U.S. House of Representatives and it can be found here.
Economic Projections and Rules of Thumb for Monetary
Policy from the Federal Reserve Bank of St. Louis is
available
here.
| Unemployment Insurance (000s) | 07/05/08 | 06/28/08 | Y/Y | 2007 | 2006 | 2005 |
|---|---|---|---|---|---|---|
| Initial Claims | 346 | 404 | 13.8% | 322 | 313 | 331 |
| Continuing Claims | -- | 3,202 | 25.7% | 2,552 | 2,459 | 2,662 |
by Robert Brusca July 10, 2008
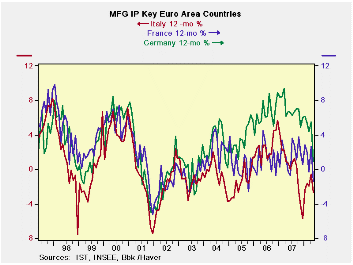
Industrial output in the Euro Area is now in a clear downturn, judging from the trends in the Zone’s main economies. For a while, as the euro rose in value, it seemed as though the Euro Area was bullet-proof. German industrial readings remained strong and even had some acceleration has the rest of the Zone and world economies seemed to feel the weight of the pressure of rising oil prices and financial distress. Now that has changed. Italy has been very weak- arguable recessionary – for some time. France has recently given up the pretense of buoyancy and has weakened sharply. In Germany Yr/Yr industrial output growth is now up by just 0.9%.
Good weather was one factor helping Europe to set aside weakness early in the year. But now the wind aided output run is having its true trend laid bare. Output is steadily decelerating in Germany the Euro Areas strongest economy as well as in, France, Italy, Spain and in the EU’s UK. Over the key time horizons for analysis output is unequivocally falling (3-Mo 6-Mo and 12-Mo) with scant exception. Quarter to date growth is weak except for Spain where it’s volatility that is king much more resiliency.
The Euro Area is weakening quickly showing why the ECB felt it only needed to hike rates once as a defense of its honor more than in pursuit of its policy objective: to cap EMU inflation at 2%. It did not feel it needed to act to knock down inflation since I suspect that it agrees with the finance ministers’ unspoken concerns that the various economies are going to do that on their own due to encroaching economic weakness that is now making itself clearly felt.
In time the ECB may undergo criticism for even this small 25bp hike. In its defense it held its hand for a long period trying not to exacerbate all the financial problems as inflation shot over its ceiling. It finally felt that with inflation MORE THAN DOUBLE its inflation ceiling, it had to be seen doing something. It’s hard to argue with that.
| Main E-zone Countries and UK IP in MFG | |||||||
|---|---|---|---|---|---|---|---|
| Mo/Mo | 3-Mo | 6-mo | 12-mo | ||||
| MFG Only | May-08 | Apr-08 | Mar-08 | May-08 | May-08 | May-08 | Q-2-Date |
| Germany: | -2.6% | -0.3% | -0.3% | -12.2% | -1.9% | 0.9% | -8.3% |
| France:IP excl Constructions | -2.6% | 1.5% | -1.1% | -8.8% | -1.7% | -1.2% | -2.0% |
| Italy | -1.5% | 0.3% | -0.2% | -5.3% | 0.9% | -2.7% | -2.6% |
| Spain | -14.6% | 27.5% | -16.9% | -32.9% | -9.5% | -7.4% | 26.7% |
| UK | -0.6% | 0.1% | -0.5% | -3.8% | -0.8% | -0.8% | -1.8% |
| Mo/Mo are simple percent changes others are at saars | |||||||

Tom Moeller
AuthorMore in Author Profile »Prior to joining Haver Analytics in 2000, Mr. Moeller worked as the Economist at Chancellor Capital Management from 1985 to 1999. There, he developed comprehensive economic forecasts and interpreted economic data for equity and fixed income portfolio managers. Also at Chancellor, Mr. Moeller worked as an equity analyst and was responsible for researching and rating companies in the economically sensitive automobile and housing industries for investment in Chancellor’s equity portfolio. Prior to joining Chancellor, Mr. Moeller was an Economist at Citibank from 1979 to 1984. He also analyzed pricing behavior in the metals industry for the Council on Wage and Price Stability in Washington, D.C. In 1999, Mr. Moeller received the award for most accurate forecast from the Forecasters' Club of New York. From 1990 to 1992 he was President of the New York Association for Business Economists. Mr. Moeller earned an M.B.A. in Finance from Fordham University, where he graduated in 1987. He holds a Bachelor of Arts in Economics from George Washington University.
More Economy in Brief


