 Global| Nov 08 2007
U.S. Initial Claims for Unemployment Insurance Drop
by:Tom Moeller
|in:Economy in Brief
Summary
Initial claims for unemployment insurance fell further last week to 317,000 from 330,000 during the week prior. It was third consecutive weekly decline and to the lowest level since early last month. The prior week's level was revised [...]
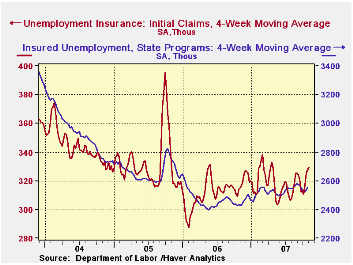
Initial claims for unemployment insurance fell further last week to 317,000 from 330,000 during the week prior. It was third consecutive weekly decline and to the lowest level since early last month. The prior week's level was revised up.
The four week moving average of initial claims rose slightly again to 329,750 (4.8% y/y), the highest level since April.There were no special factors indicated as having influenced the figures beyond a slight increase due to wildfires in California.
A claims level below 400,000 typically has been associated with growth in nonfarm payrolls. During the last six years there has been a (negative) 78% correlation between the level of initial claims and the m/m change in nonfarm payroll employment.
Continuing claims for unemployment insurance fell a slight 4,000 after the 60,000 spike upward during the prior week. It was revised down slightly.
The continuing claims numbers lag the initial claims figures
by one week.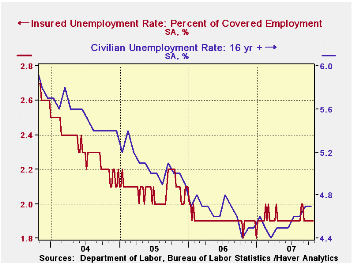
The insured rate of unemployment was stable at 1.9% with a downwardly level during the week prior.
By state and versus one year ago, large declines in initial claims were logged in Indiana, Kentucky, New York, Michigan, Missouri, Virginia and South Carolina. Large y/y increases were in Pennsylvania, Ohio, California, Maryland, Texas, Florida and Arizona.
This morning's JEC testimony by Federal Reserve Board Chairman Ben S. Bernanke, The Economic Outlook, is available here.
Yesterday's presentation, The End of History, by Fed GovernorKevin Warsh to the New York Association for Business Economics can be found here.
| Unemployment Insurance (000s) | 11/03/07 | 10/27/07 | Y/Y | 2006 | 2005 | 2004 |
|---|---|---|---|---|---|---|
| Initial Claims | 317 | 330 | 1.6% | 313 | 331 | 343 |
| Continuing Claims | -- | 2,579 | 6.0% | 2,459 | 2,662 | 2,924 |
by Robert Brusca November 8, 2007
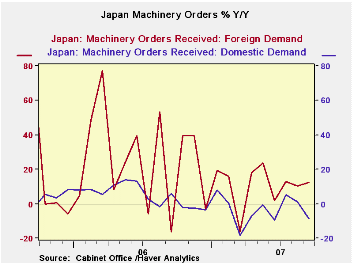
Japan’s machinery orders do show some improvement in the
pattern for sequential growth rates for core orders. That series omits
the most volatile components of the orders series. Still the current
readings remain negative (m/m 3-mo, 6-mo and Y/Y). Foreign demand for
the overall orders series is oscillating at a moderate reading up by
4.8% over three months and down by 7.8% in September, after a strong
August. Domestic demand, however, shows still weak trends with a dive
in the Yr/Yr growth rate in September.
| Japan Machinery Orders | ||||||
|---|---|---|---|---|---|---|
| m/m % | Saar % | |||||
| SA | Sep-07 | Aug-07 | Jul-07 | 3-Mos | 6-Mos | 12-Mos |
| Total | -14.5% | 7.1% | -0.6% | -31.4% | 8.9% | -1.2% |
| Core Orders* | -7.6% | -7.7% | 17.0% | -0.6% | -6.4% | -6.6% |
| Total Orders | ||||||
| Foreign Demand | -7.8% | 23.0% | -10.8% | 4.8% | 17.9% | 12.3% |
| Domestic demand | -9.6% | -4.2% | 6.7% | -27.0% | 20.8% | -8.7% |
| * Excl ships and electric power | ||||||
by Robert Brusca November 8, 2007
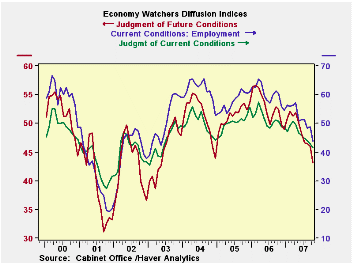
The economy watcher’s index is dropping rapidly and so is the
future index. Each of them is at a relative low point in its five year
range in the low 40th percentile of it. The weakness in these survey indexes
is set in the table against the NTC survey of manufacturing sentiment.
MFG sentiment is even weaker, residing in the bottom 15 percentile of
its range. Clearly Japan is
having some difficulty with growth. Both the anecdotal economy watchers
survey and the more grounded NTC survey of manufacturers show fading
growth and very low current activity readings.
| Key Japanese Surveys | |||||||
|---|---|---|---|---|---|---|---|
| Raw readings of each survey | Percent of 5Yr range | ||||||
| Oct-07 | Sep-07 | Aug-07 | Jul-07 | Oct-07 | Sep-07 | Aug-07 | |
| Diffusion | |||||||
| Economy Watchers | 41.5 | 42.9 | 44.1 | 44.7 | 27.5% | 33.9% | 39.4% |
| Employment | 43.8 | 48.8 | 48.3 | 51.2 | 21.5% | 39.4% | 37.6% |
| Future | 43.1 | 46.0 | 46.5 | 46.7 | 32.2% | 46.7% | 49.2% |
| NTC MFG | 49.5 | 49.8 | -- | -- | 15.5% | 18.7% | 16.2% |
by Robert Brusca November 8, 2007
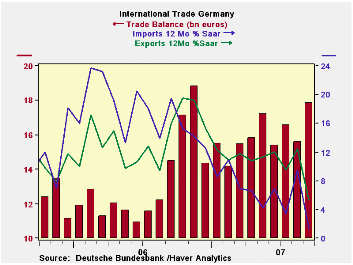
Imports fell by a sharp 2.6% as exports headed higher by 0.7%
expanding the German trade surplus. Trends show that exports are still
up strongly while imports are lagging with a 12.3% 3-month export
growth rate matched against a 0.5% pace for imports for that same
period. Over 6 and 12 months export growth continues to outdo imports.
Note that the detailed growth rates in the table are executed from one
month older data due to lagging observation availability. Germany
may seem to be escaping an adverse impact on GDP by seeing its trade
surplus widen but since the escape is due to weak imports, which may
themselves reflect a weakening economy, it is too soon to make that
judgment.
| German Trade in Goods Trends | |||||
|---|---|---|---|---|---|
| m/m% | % Saar | ||||
| Sep-07 | Aug-07 | 3M | 6M | 12M | |
| Balance* | €€ 17.86 | €€ 15.57 | €€ 16.66 | €€ 16.40 | €€ 16.16 |
| EXPORTS | |||||
| All Exports | 0.7% | 2.4% | 12.3% | 10.8% | 5.4% |
| Capital Goods | -- | 2.1% | 16.6% | 7.5% | 10.9% |
| Motor Vehicles | -- | -0.5% | 16.4% | 8.9% | 12.6% |
| Consumer Goods | -- | 4.7% | 36.1% | 17.4% | 14.3% |
| IMPORTS | |||||
| All Imports | -2.6% | 4.5% | -0.5% | 5.7% | 1.4% |
| Capital Goods | -- | 9.2% | 39.2% | 1.6% | 0.6% |
| Motor Vehicles | -- | 16.7% | 50.6% | 34.5% | 18.8% |
| Consumer Goods | -- | 5.0% | 68.4% | 9.4% | 11.7% |
| *Billions of Euros; mo or period average; shaded area trends lag one month | |||||

Tom Moeller
AuthorMore in Author Profile »Prior to joining Haver Analytics in 2000, Mr. Moeller worked as the Economist at Chancellor Capital Management from 1985 to 1999. There, he developed comprehensive economic forecasts and interpreted economic data for equity and fixed income portfolio managers. Also at Chancellor, Mr. Moeller worked as an equity analyst and was responsible for researching and rating companies in the economically sensitive automobile and housing industries for investment in Chancellor’s equity portfolio. Prior to joining Chancellor, Mr. Moeller was an Economist at Citibank from 1979 to 1984. He also analyzed pricing behavior in the metals industry for the Council on Wage and Price Stability in Washington, D.C. In 1999, Mr. Moeller received the award for most accurate forecast from the Forecasters' Club of New York. From 1990 to 1992 he was President of the New York Association for Business Economists. Mr. Moeller earned an M.B.A. in Finance from Fordham University, where he graduated in 1987. He holds a Bachelor of Arts in Economics from George Washington University.
More Economy in Brief


