 Global| Sep 20 2007
U.S. Initial Claims For Jobless Insurance Fell
by:Tom Moeller
|in:Economy in Brief
Summary
Initial claims for jobless insurance fell 9,000 to 311,000 and reversed all of the little revised 5,000 rise during the prior week. An unchanged reading of 322,000 had been expected by a Consensus of economists. A claims level below [...]
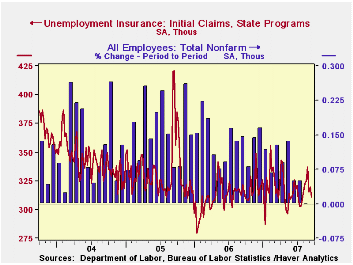
Initial claims for jobless insurance fell 9,000 to 311,000 and reversed all of the little revised 5,000 rise during the prior week. An unchanged reading of 322,000 had been expected by a Consensus of economists.
A claims level below 400,000 typically has been associated with growth in nonfarm payrolls. During the last six years there has been a (negative) 78% correlation between the level of initial claims and the m/m change in nonfarm payroll employment.
The four-week moving average of initial claims rose slightly to 320,750 (1.3% y/y).
The latest figure covers the survey week for nonfarm payrolls in September and claims fell 14,000 (4.3%) from the August period. 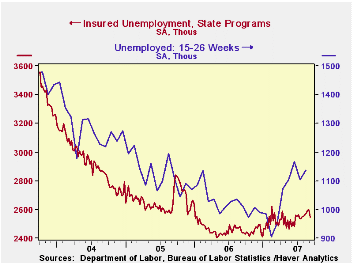
Continuing claims for unemployment insurance fell by 53,000 and reversed all of the increases during the prior several weeks. The decline during the prior seek was revised to a slight increase. The continuing claims numbers lag the initial claims figures by one week.
Since yearend 2006, continuing claims have risen 132,000 or by 5.5%. During that period, the monthly survey of household employment from BLS indicates that individuals who were unemployed for 15-26 weeks rose 14.8%. The average weeks of unemployment rose to 16.9 from 15.9.
Reconciling the rise in these figures and the rough stability of the initial claims numbers may be that one represents the "flow" of unemployment while the other captures the "stock" of unemployed individuals. The payroll employment figures from BLS also represent the flow.
The insured rate of unemployment fell to 1.9%.
| Unemployment Insurance (000s) | 09/15/07 | 09/08/07 | Y/Y | 2006 | 2005 | 2004 |
|---|---|---|---|---|---|---|
| Initial Claims | 311 | 320 | -3.4% | 313 | 331 | 343 |
| Continuing Claims | -- | 2,544 | 4.0% | 2,545 | 3.3% | 2,459 |
by Tom Moeller September 20, 2007
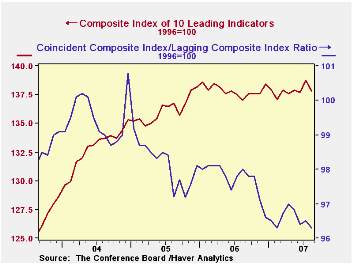
The composite index of leading economic indicators fell nearly twice expectations and declined 0.6% last month, fully reversing all of the prior month's increase, according to the Conference Board.
During the last ten years there has been a 59% correlation between the y/y change in the leading indicators index and the lagged change in real GDP.
The breadth of one month gains amongst the 10 components of the leading index plunged to 15% in August from 70% in July.
All of the components of the leading indicators index made a negative contribution except the money supply. Declining building permits have made a negative contribution for six out of the last eight months.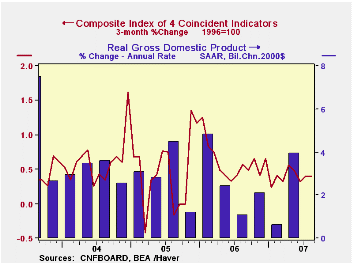
The method of calculating the contribution to the leading index from the spread between 10 year Treasury securities and the Fed funds rate has been revised. A negative contribution will now occur only when the spread inverts rather than when declining as in the past. More details can be found here.
The leading index is based on eight previously reported economic data series. Two series, orders for consumer goods and orders for capital goods, are estimated.
The coincident indicators increased 0.1% after a 0.2% rise during July. Over the last ten years there has been a 91% correlation between the y/y change in the coincident indicators and real GDP growth.
The lagging index rose 0.3% during August. As a result, the ratio of coincident to lagging indicators (a measure of economic excess) fell slightly and has been roughly unchanged all year.
Visit the Conference Board's site for coverage of leading indicator series from around the world.
| Business Cycle Indicators | August | July | Y/Y | 2006 | 2005 | 2004 |
|---|---|---|---|---|---|---|
| Leading | -0.6% | 0.7% | 0.6% | 1.2% | 2.5% | 7.1% |
| Coincident | 0.1% | 0.2% | 1.7% | 2.5% | 2.1% | 2.0% |
| Lagging | 0.3% | 0.2% | 3.5% | 3.0% | 3.5% | 0.6% |
by Robert Brusca September 20, 2007
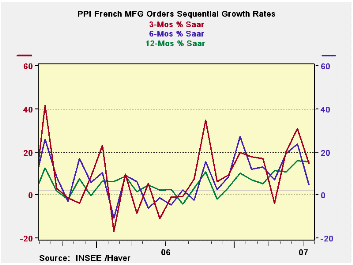
Manufacturing orders are sharply lower in France in July following a pattern we have seen among previous European reports of industrial orders in July. Like those reported earlier, French new orders, which dropped sharply in July, merely offset a similarly strong rise in June. France’s Yr/Yr trend remains firmly higher with Yr/Yr rates of growth of 15.5% overall and 14.8% for foreign orders. Despite the drop in July, the three-month growth is strong and accelerating compared to the six-month rate. However, in the new quarter (Q3) orders are growing at a pace of only 1.3% annualized. This could be the start of a slowing in orders as the euro has climbed and has just recently broken to a new all-time high above $1.40. This is what will bear watching in the months ahead. As ‘current’ data are for July, and the Euro’s new peak is in mid-September.
| French Orders | ||||||
|---|---|---|---|---|---|---|
| Saar exept m/m | Jul-07 | Jun-07 | May-07 | 3-mo | 6-mo | 12-mo |
| Total | -2.9% | 3.4% | 3.1% | 14.6% | 4.9% | 15.5% |
| Foreign | -2.0% | 2.2% | 3.5% | 16.0% | 4.8% | 14.8% |
by Carol Stone September 20, 2007
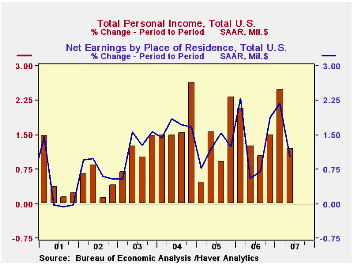
Today, the BEA reported personal income by state for Q2. This sizable body of data, carried in Haver's PIQR database, shows the composition of aggregate personal income for each state by type of income and earnings by industry. In Q2 total personal income for the country grew 1.2%, following 2.5% in Q1. Q1 had included the payment of large bonuses covering year-end 2006, and these enlarged the income growth reported for Q1 and the apparent slowdown in Q2. The year-on-year growth in Q2 personal income, though, was 6.4%, well in line with the performance of the last three years. Similarly, earnings rose 1.0% in Q2 compared with 2.2% in Q1; the year-on-year growth was 5.9%, also running about average with recent years' experience. These data levels are given in seasonally adjusted annual rates, but the % changes are cited as quarterly rates by BEA.
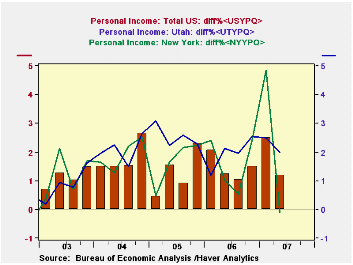
By state, personal income grew as much as 2.0% in Q2 in Utah and it declined outright in New York -- by 0.1%. New York workers had received the biggest part of the Q1 bonus money and income there then expanded by 4.8%. So the decline in Q2 should be seen as weak only relative to the bulge in Q1 growth. In Utah, the big Q2 gains income came in earnings, with outsized gains in professional and technical industries, durable goods manufacturing and construction.
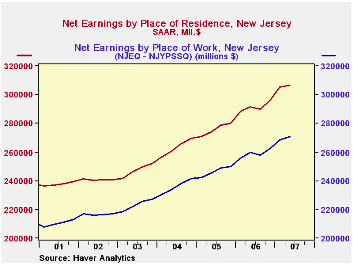
This report highlights a special feature of state income data. Income is measure according to residence; I live and work in New York, for instance, so all of my income occurs in New York. But earnings are compiled from establishment data, so they represent earnings were people work, which is not necessarily the state they they live in. Adjustment is needed to reconcile these differences Our data table below shows two states with a noticeable impact from commuters. Many New Jerseyans work in New York. So earnings (defined here as wages and salaries net of contributions for social insurance) defined by residence are larger in New Jersey than those reported for workers. So we see that the "worker" data are increased by a positive factor, which was $35.9 billion in Q2, or 11.7% of earnings of residents.
In contrast, many people who work in Missouri live in Kansas or Illinois. So Missouri has a negative "residence adjustment". In Q2 it was $4.3 billion, or 2.8% of earnings reported for workers in the state. That is, 2.8% of earnings earned in Missouri was transferred to other states where the workers actually reside.
Most states have a negligible residence adjustment since nearly everyone lives and works in the same state. But all states have even a small amount. And the country as a whole has a tiny but negative residence adjustment, since some people who work in the US live in another country.[Note that these personal income data are compiled separately from the personal income reported in the National Income Accounts. The differences would be the subject of another commentary, but for now, it is enough to say that the sum of the states need not equal the total of personal income in the more familiar national data. It are quite close, however.]
| Personal Income by State | Q2 2007 | Q1 2007 | Q4 2006 | Year Ago | 2006 | 2005 | 2004 |
|---|---|---|---|---|---|---|---|
| Personal Income, Total US | 11,595 | 11,459 | 11,181 | 10,902 | 10,967 | 10,284 | 9,711 |
| % Change | 1.2 | 2.5 | 1.5 | 6.4 | 6.6 | 5.9 | 6.1 |
| Net Earnings by Residence | 7,893 | 7,812 | 7,646 | 7,453 | 7,504 | 7,104 | 6,739 |
| % Change | 1.0 | 2.2 | 1.9 | 5.9 | 5.6 | 5.4 | 6.5 |
| Earnings by State | |||||||
| New Jersey | 307 | 305 | 296 | 291 | 291 | 276 | 263 |
| % Change | 0.5 | 3.0 | 2.3 | 5.2 | 5.7 | 4.8 | 6.4 |
| Residence Adjustment | 35.9 | 36.7 | 33.7 | 31.7 | 32.5 | 29.1 | 26.9 |
| Missouri | 132 | 131 | 129 | 127 | 127 | 121 | 117 |
| % Change | 1.3 | 1.5 | 1.7 | 4.5 | 4.4 | 4.1 | 5.5 |
| Residence Adjustment | -4.3 | -4.3 | -4.2 | -4.3 | -4.2 | -4.2 | -3.8 |

Tom Moeller
AuthorMore in Author Profile »Prior to joining Haver Analytics in 2000, Mr. Moeller worked as the Economist at Chancellor Capital Management from 1985 to 1999. There, he developed comprehensive economic forecasts and interpreted economic data for equity and fixed income portfolio managers. Also at Chancellor, Mr. Moeller worked as an equity analyst and was responsible for researching and rating companies in the economically sensitive automobile and housing industries for investment in Chancellor’s equity portfolio. Prior to joining Chancellor, Mr. Moeller was an Economist at Citibank from 1979 to 1984. He also analyzed pricing behavior in the metals industry for the Council on Wage and Price Stability in Washington, D.C. In 1999, Mr. Moeller received the award for most accurate forecast from the Forecasters' Club of New York. From 1990 to 1992 he was President of the New York Association for Business Economists. Mr. Moeller earned an M.B.A. in Finance from Fordham University, where he graduated in 1987. He holds a Bachelor of Arts in Economics from George Washington University.
More Economy in Brief


