 Global| Mar 04 2010
U.S. Initial Claims For InsuranceFall Back
by:Tom Moeller
|in:Economy in Brief
Summary
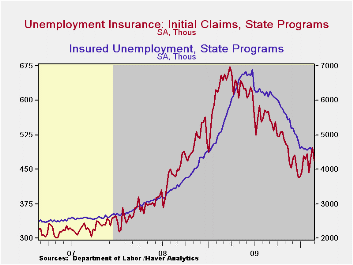
Today's Labor Department report indicated that initial claims for jobless insurance fell 29,000 last week to 469,000 from an upwardly revised 498,000 during the prior week. Claims rose slightly for the full month but remained down [...]
 Today's
Labor Department report indicated that initial claims for jobless
insurance fell 29,000 last week to 469,000 from an upwardly revised
498,000 during the prior week. Claims rose slightly for the full month
but remained down from the recession peak of 674,000 hit last March.
Moreover, claims remained near the lowest level since January 2009. The
weekly decline in claims slightly exceeded Consensus expectations for a
drop to 475,000. The four-week moving average of initial claims slipped
to 470,750.
Today's
Labor Department report indicated that initial claims for jobless
insurance fell 29,000 last week to 469,000 from an upwardly revised
498,000 during the prior week. Claims rose slightly for the full month
but remained down from the recession peak of 674,000 hit last March.
Moreover, claims remained near the lowest level since January 2009. The
weekly decline in claims slightly exceeded Consensus expectations for a
drop to 475,000. The four-week moving average of initial claims slipped
to 470,750.
Continuing claims for unemployment insurance during the latest week fell to a new cycle-low and were down by one-third since late-June. The overall decline is a function of the improved job market but also reflects the exhaustion of 26 weeks of unemployment benefits. Continuing claims provide an indication of workers' ability to find employment. The four-week average of continuing claims fell to a cycle low of 4,575,750. This series dates back to 1966.
Extended benefits for unemployment insurance dropped sharply to another cycle low of 178,469. They were down by two-thirds from a peak of 597,688 reached in November.
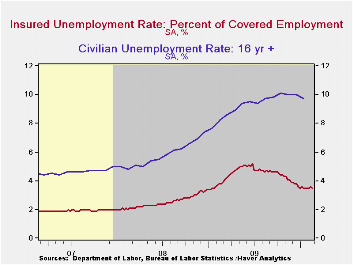
The insured rate of unemployment slipped to 3.5% from an upwardly revised 3.6% during the prior week. The rate reached a high of 5.2% during late-June. During the last ten years, there has been a 93% correlation between the level of the insured unemployment rate and the overall rate of unemployment published by the Bureau of Labor Statistics.
The highest insured unemployment rates in the week ending February 14 were in Alaska (7.4% percent), Oregon (6.4), Idaho (6.3), Montana (6.3), Wisconsin (6.2), Michigan (5.8), Nevada (5.7), Pennsylvania (6.4), and North Carolina (5.4). The lowest insured unemployment rates were in Virginia (2.3), Texas (2.4), Florida (3.2), Georgia (3.4), Mississippi (3.6), Wyoming (3.7), Ohio (3.8), Maryland (3.9), Indiana (4.0), New York (4.1) and Maine (4.4). These data are not seasonally adjusted but the overall insured unemployment rate is.
The unemployment insurance claims data is available in Haver's WEEKLY database and the state data is in the REGIONW database.
Changes in the Aggregate Labor Force Participation Rate from the Federal Reserve Bank of Atlanta is available here.
| Unemployment Insurance (000s) | 2/27/10 | 2/20/10 | 2/13/10 | Y/Y | 2009 | 2008 | 2007 |
|---|---|---|---|---|---|---|---|
| Initial Claims | 469 | 498 | 474 | -27.1% | 573 | 419 | 321 |
| Continuing Claims | -- | 4,500 | 4,634 | -11.3% | 5,835 | 3,345 | 2,552 |
| Insured Unemployment Rate (%) | -- | 3.5 | 3.6 | 4.3 (3/2009) | 4.4 | 2.5 | 1.9 |
by Robert Brusca March 4, 2010
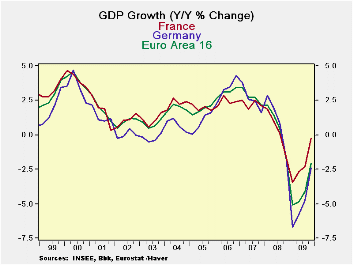
EMU GDP rose by 0.5% Saar in 2009-Q4. Private consumption in the Zone fell at a -0.1% annual rate. Meanwhile exports and imports surged at growth rates of 6% and 7%, respectively. Public consumption also fell in Q4 at a -0.5% annual rate. Capital formation after rising in Q3 retracted again in Q4. Domestic demand was a weak -0.8%.
France is closing in on positive GDP growth and is closer than either Germany or EMU as of Q4. But Germany with a much deeper hole that its GDP fell into is rising faster from its extreme depths.
Portugal’s numbers still aren’t in for Q4. But among those countries we list in the table that have reported, Greece, Italy and Spain are the only ones with falling GDP in Q4. These are the countries with debt problems of various sorts in EMU. It is interesting that the indebtedness seems to hold them back from recovery at the same pace as fellow EU/EMU members.
| EMU GDP | |||||||
|---|---|---|---|---|---|---|---|
| Consumption | Capital Formation | Domestic Demand |
|||||
| GDP | Private | Public | Total | Exports | Imports | ||
| % Change Q/Q (saar) ; X-M is Q/Q change in Blns of euros | |||||||
| Q4-09 | 0.5% | -0.1% | -0.5% | -3.1% | 6.2 | 7.0% | -0.8% |
| Q3-09 | 1.7% | -0.7% | 3.1% | 7.1% | 0.7 | 11.9% | 1.6% |
| Q2-09 | -0.5% | 0.3% | 2.4% | -17.7% | 13.1 | -4.5% | -3.1% |
| Q1-09 | -9.6% | -1.9% | 2.2% | -33.1% | -6.2 | -29.3% | -8.7% |
| % Change Yr/Yr; X-M is Yr/Yr change in Gap in Blns of euros | |||||||
| Q4-09 | -2.1% | -0.6% | 1.8% | -13.1% | 13.8 | -5.2% | -2.8% |
| Q3-09 | -4.1% | -1.1% | 2.5% | -14.9% | -15.1 | -13.5% | -3.5% |
| Q2-09 | -4.9% | -1.0% | 2.2% | -16.2% | -27.1 | -17.0% | -3.7% |
| Q1-09 | -5.1% | -1.4% | 2.4% | -14.1% | -34.5 | -16.4% | -3.5% |
| 5-Yrs | 0.7% | 0.8% | 2.1% | -1.0% | 0.5 | 1.4% | 0.7% |
As of Q4 only Greece is seeing its Yr/Yr GDP growth continue to slip at a faster pace than in earlier quarters. The UK has a larger Yr/Yr drop in Q4 but it has improved its Yr/Yr growth rate from -5.3% in Q3 to -3.3% in Q4. Only the US has a positive Yr/Yr rate of growth in Q4; Switzerland is at zero.
The quarterly growth rates are already turning positive and have been doing so for two quarters in a row in most countries. Clearly recovery is afoot. But we are reminded that domestic demand is lagging in the Zone and that it is a sector that is very important to recovery. Every nation cannot recover with export-led growth; that defies the rules of GDP and balance of payments accounting. At some point the recovery has to become home-grown. With the US economy looking like its recovery may not shift into overdrive it is even more important than ever for each country to elevate its own domestic demand.
| Euro-Area Retail Sales | ||||||
|---|---|---|---|---|---|---|
| M/M | Saar | |||||
| Jan-10 | Dec-09 | Nov-09 | 3-Mo | 6-MO | 12-Mo | |
| Zone Total Value | 0.2% | 0.2% | 0.2% | 2.4% | 1.1% | -1.1% |
| Food,Bev Tobacco | -0.1% | -0.1% | -0.2% | -1.8% | -2.1% | -2.1% |
| Registrations: | ||||||
| Motor Vehicle Reg | -0.4% | -3.1% | 1.1% | -9.4% | -0.8% | 20.8% |
| NonFood Country detail: Volume | ||||||
| Germany Value | 0.0% | 0.9% | -1.2% | -1.2% | -0.6% | -0.2% |
| UK(EU) Volume | -1.8% | -0.3% | -0.4% | -9.3% | -3.4% | 0.8% |
by Tom Moeller March 4, 2010
 p
p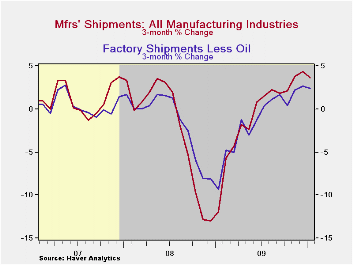
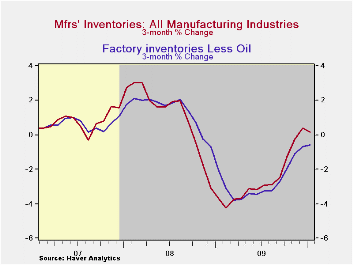
Improved demand has changed attitudes about holding inventory. Factory inventories increased 0.2% during January and have risen during three of the last four months. That compares with sharp declines during the twelve months through September which lowered inventory levels by 11.9%. Even accounting for higher oil prices there has been a turn. Without oil refineries factory inventories were roughly unchanged during the last four months and the -0.6% three-month change compares to -3.8% at its depth early last year.
Primary metals inventories during the last three months rose 3.1% after a 10.2% decline one-year ago. Electrical equipment inventories fell 0.8% after a 7.2% decline at its deepest last March and machinery inventories fell 1.8% versus at a 5.2% decline at the deepest last Spring. Even furniture inventories went down at a slower 2.5% three-month rate. In the nondurable area apparel inventories fell at a lessened 1.3% rate while paper products fell 1.7% versus -6.1% one year ago.
Higher factory shipments have encouraged the turn. Shipments rose 0.3% during January following four months of strength. Here again rising oil prices played a role. But even excluding oil, an unchanged January reading followed four months of strength. The three-month change has shifted to positive 2.4% from -9.4% one year ago. Shipments of machinery, electrical and transportation equipment have led the turn.
| Factory Survey (NAICS, %) | January | December | November | Y/Y | 2009 | 2008 | 2007 |
|---|---|---|---|---|---|---|---|
| Inventories | 0.2 | -0.2 | 0.2 | -7.5 | -8.7 | 2.2 | 3.7 |
| Excluding Transportation | 0.1 | -0.1 | 0.3 | -8.1 | -9.2 | -0.5 | 2.7 |
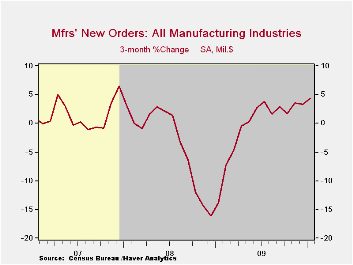
| New Orders | 1.7 | 1.5 | 1.0 | 9.5 | -17.2 | 0.0 | 1.9 |
| Excluding Transportation | 0.1 | 1.5 | 2.1 | 8.9 | -15.8 | 3.0 | 1.2 |
| Shipments | 0.3 | 1.8 | 1.6 | 5.5 | -15.2 | 1.6 | 1.2 |
| Excluding Transportation | 0.8 | 1.3 | 1.7 | 6.2 | -15.3 | 3.5 | 1.5 |
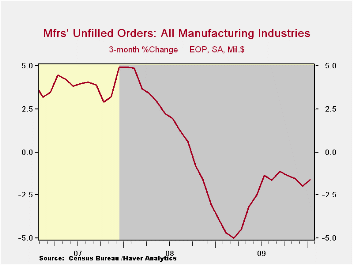
| Unfilled Orders | 0.0 | -0.9 | -0.7 | -8.5 | -10.2 | 3.4 | 17.1 |
| Excluding Transportation | -0.0 | 0.4 | 0.2 | -6.0 | -8.4 | -1.4 | 8.2 |
by Tom Moeller March 4, 2010
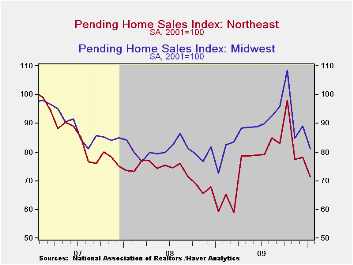
 Bad
weather
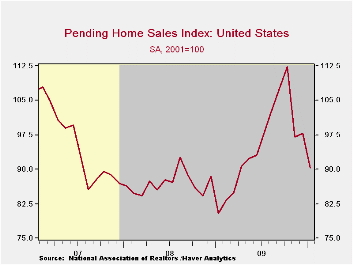
had a noticeable effect on January housing activity. However, the
National Association of Realtors (NAR) reported an outsized effect on
pending home sales which fell 7.6% m/m from December to their lowest
level since March of last year. Nevertheless, home sales remained up
12.3% from the January low. The latest decline compares with Consensus
expectations for a modest increase. The data were revised starting in
2008.
Bad
weather
had a noticeable effect on January housing activity. However, the
National Association of Realtors (NAR) reported an outsized effect on
pending home sales which fell 7.6% m/m from December to their lowest
level since March of last year. Nevertheless, home sales remained up
12.3% from the January low. The latest decline compares with Consensus
expectations for a modest increase. The data were revised starting in
2008.
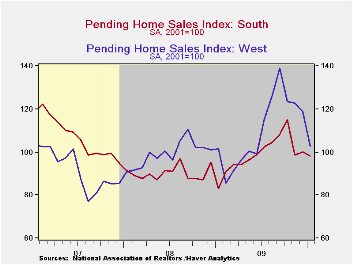
Sharp monthly gains in home sales were recorded across the country but the largest was out West.
These home sales figures are analogous to the new home sales data from the Commerce Department in that they measure existing home sales when the sales contract is signed, not at the time the sale is closed. The series dates back to 2001 and the data is available in Haver's PREALTOR database.
The Fed's latest Beige Book covering regional economic conditions can be found here.
| Pending Home Sales (2001=100) | January | December | November | Y/Y | 2009 | 2008 | 2007 |
|---|---|---|---|---|---|---|---|
| Total | 90.4 | 97.8 | 97.0 | 12.3% | 95.1 | 86.9 | 95.9 |
| Northeast | 71.3 | 78.1 | 77.4 | 20.4 | 76.7 | 73.0 | 86.1 |
| Midwest | 81.2 | 89.2 | 84.8 | 11.8 | 88.8 | 80.7 | 89.6 |
| South | 98.1 | 100.2 | 98.5 | 18.1 | 98.9 | 90.3 | 107.4 |
| West | 102.9 | 118.5 | 122.8 | 1.5 | 109.9 | 99.2 | 92.1 |

Tom Moeller
AuthorMore in Author Profile »Prior to joining Haver Analytics in 2000, Mr. Moeller worked as the Economist at Chancellor Capital Management from 1985 to 1999. There, he developed comprehensive economic forecasts and interpreted economic data for equity and fixed income portfolio managers. Also at Chancellor, Mr. Moeller worked as an equity analyst and was responsible for researching and rating companies in the economically sensitive automobile and housing industries for investment in Chancellor’s equity portfolio. Prior to joining Chancellor, Mr. Moeller was an Economist at Citibank from 1979 to 1984. He also analyzed pricing behavior in the metals industry for the Council on Wage and Price Stability in Washington, D.C. In 1999, Mr. Moeller received the award for most accurate forecast from the Forecasters' Club of New York. From 1990 to 1992 he was President of the New York Association for Business Economists. Mr. Moeller earned an M.B.A. in Finance from Fordham University, where he graduated in 1987. He holds a Bachelor of Arts in Economics from George Washington University.
More Economy in Brief


