 Global| Sep 15 2003
U.S. Industrial Production Weak
by:Tom Moeller
|in:Economy in Brief
Summary
Industrial production rose less than expected last month by 0.1%. The Consensus of economists forecast a 0.3% gain. Prior months' figures were revised up slightly. Output in the manufacturing sector fell 0.2% (-1.5% y/y) although the [...]
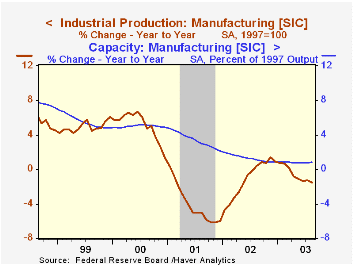
Industrial production rose less than expected last month by 0.1%. The Consensus of economists forecast a 0.3% gain. Prior months' figures were revised up slightly.
Output in the manufacturing sector fell 0.2% (-1.5% y/y) although the previously reported 0.2% gain in July was revised up to 0.5%.
Output in selected high-technology industries jumped a whopping 2.3% (12.1% y/y), the strongest one-month gain since September 2000. Strength was across-the-board with output of computers and peripheral equipment up 1.9% (22.2% y/y). Output of semiconductors & related equipment rose 2.7% (19.1% y/y) while communications equipment output rose 1.9% (-4.8% y/y).
Excluding high-tech factory output fell 0.3% (-2.3% y/y) and reversed an upwardly revised 0.3% July gain. Motor vehicle output sagged 2.6% (-3.0% y/y) following a 3.4% July jump. Output of electrical equipment and appliances rose 0.2% (-2.1% Y/Y) and the previously reported 0.7% July drop was revised to a 0.6% gain. Output of furniture fell 0.6% (-2.6% y/y) and output of non-durable goods was unchanged for the second month.
Total capacity utilization was unchanged at 74.6%. Factory sector utilization fell slightly to 72.7%. Growth in capacity remained slow at 1.1% y/y versus 1.5% growth last year and 3.2% growth in 2001. Growth in factory sector capacity has been an even slower 0.8% y/y versus 1.3% growth last year.
| Production & Capacity | Aug | July | Y/Y | 2002 | 2001 | 2000 |
|---|---|---|---|---|---|---|
| Industrial Production | 0.1% | 0.7% | -1.0% | -0.8% | -3.5% | 4.7% |
| Capacity Utilization | 74.6% | 74.6% | 76.1%(8/02) | 75.6% | 77.3% | 82.7% |
by Tom Moeller September 15, 2003
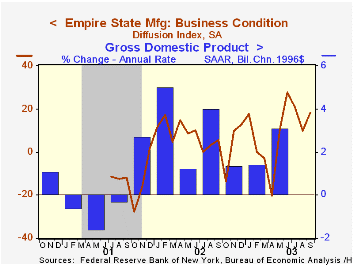
The Empire State Index of General Business Conditions for September rose somewhat more than expected. The NY Fed's Manufacturing Survey indicated that the index rose to 18.35 this month versus Consensus expectations for a reading of 15.0.
The new orders index improved modestly for September and for 3Q was at the highest level since 1Q 2002. Shipments fell in September but for 3Q the index was the highest level in the survey's brief history. Employment remained weak.
The index of prices paid rose sharply to 15.60, the highest level since April.
The survey includes measures of business expectations six months ahead. This diffusion index fell slightly in September but for 3Q was at the highest level since 2Q 2002. Expectations for capital expenditures firmed.
The Empire State Manufacturing Survey is a monthly survey of manufacturers in New York State conducted by the Federal Reserve Bank of New York. Participants from across the state in a variety of industries respond to a questionnaire and report the change in a variety of indicators from the previous month. Respondents also state the likely direction of these same indicators six months ahead. April 2002 is the first report, although survey data date back to July 2001.
Like the Philadelphia Fed Index of General Business Conditions, the Empire State Business Conditions Index reflects answers to an independent survey question, not the components.
For the latest Empire State Manufacturing Survey report, click here.
| Empire State Manufacturing Survey | Sept | Aug | Y/Y | 2002 | 2001 |
|---|---|---|---|---|---|
| General Business Conditions (diffusion index) | 18.35 | 9.98 | 5.59 | 7.10 | -13.02 |
by Tom Moeller September 15, 2003
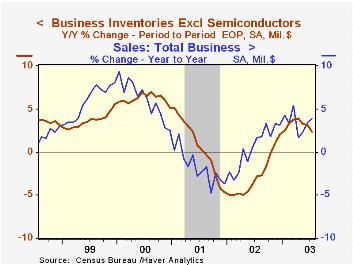
Total business inventories fell an expected 0.1% in July. The decline lowered inventories 0.3% below the March level.
Overall business sales jumped 1.6% m/m (3.8% y/y). The surge followed a 1.3% gain in June. Surging retail sales led the two-month gains but retail spending slowed last month.
Retail inventories rose again as inventories of motor vehicles and parts rose 0.3% (13.9% y/y). Non-auto inventories also rose 0.3% for the second month. Inventories of furniture (5.0% y/y) and building materials (7.0% y/y) continued strong.
The inventory-to-sales ratio fell m/m to 1.37, a record low for the series since it was redefined starting in 1992.
| Business Inventories | July | June | Y/Y | 2002 | 2001 | 2000 |
|---|---|---|---|---|---|---|
| Total | -0.1% | 0.0% | 2.4% | 2.1% | -4.7% | 5.1% |
| Retail | 0.3% | 0.4% | 6.3% | 7.6% | -2.9% | 6.0% |
| Retail excl. Autos | 0.3% | 0.3% | 2.7% | 2.5% | -1.2% | 3.7% |
| Wholesale | 0.0% | -0.0% | 1.0% | 0.4% | -4.9% | 6.1% |
| Manufacturing | -0.5% | -0.3% | -0.5% | -1.8% | -6.1% | 3.8% |
by Tom Moeller September 15, 2003
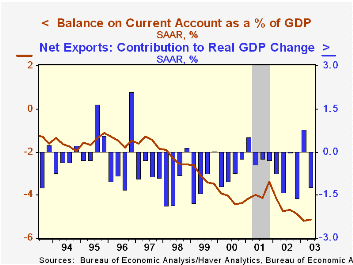
The US current account deficit was as expected at $138.7B last quarter, virtually unchanged from 1Q. The figures are a record for the deficit. Through 2Q the current account deficit ran at a $555B annual rate.
The deficit in goods trade deteriorated to $551.9B (AR) in 2Q03 versus a $482.9B deficit for all of last year and $427.2B in 2001. Exports of merchandise rose 0.4% following a 5.1% decline last year and a 6.9% drop in 2001. Goods imports rose 0.9% vs. a 1.6% rise last year.
The surplus on services rose just slightly q/q to $58.3B (AR) in 2Q. That was down from surplus of $64.8B last year. The peak services surplus was $91.1B in 1997.
| US Int'l Balance of Payments | 2Q '03 | 1Q '03 | Y/Y | 2002 | 2001 | 2000 |
|---|---|---|---|---|---|---|
| Current Account Deficit | $138.7B | $138.7B | $122.8B | $480.9B | $393.7B | $411.5B |
| % of GDP | 5.1% | 5.2% | 4.7% | 4.6% | 3.9% | 4.2% |
| Goods/Services/Income Deficit | $121.7B | $121.4B | $109.3B | $422.0B | $347.1B | $355.8B |
| Exports | 0.2% | -0.2% | 1.1% | -4.3% | -9.3% | 12.8% |
| Imports | 0.2% | 1.8% | 3.8% | 1.2% | -7.9% | 18.2% |
| Unilateral Transfers Deficit | $16.9B | $17.3B | $13.5B | $58.9B | $46.6B | $55.7B |

Tom Moeller
AuthorMore in Author Profile »Prior to joining Haver Analytics in 2000, Mr. Moeller worked as the Economist at Chancellor Capital Management from 1985 to 1999. There, he developed comprehensive economic forecasts and interpreted economic data for equity and fixed income portfolio managers. Also at Chancellor, Mr. Moeller worked as an equity analyst and was responsible for researching and rating companies in the economically sensitive automobile and housing industries for investment in Chancellor’s equity portfolio. Prior to joining Chancellor, Mr. Moeller was an Economist at Citibank from 1979 to 1984. He also analyzed pricing behavior in the metals industry for the Council on Wage and Price Stability in Washington, D.C. In 1999, Mr. Moeller received the award for most accurate forecast from the Forecasters' Club of New York. From 1990 to 1992 he was President of the New York Association for Business Economists. Mr. Moeller earned an M.B.A. in Finance from Fordham University, where he graduated in 1987. He holds a Bachelor of Arts in Economics from George Washington University.
More Economy in Brief


