 Global| Oct 16 2007
U.S. Industrial Production Gain Minimal
by:Tom Moeller
|in:Economy in Brief
Summary
Industrial production nudged up minimally last month. The 0.1% rise followed no change in August. The September gain matched Consensus expectations. Factory output fared no better and posted no change after an unrevised 0.3% August [...]
Industrial production nudged up minimally last month. The 0.1% rise followed no change in August. The September gain matched Consensus expectations.
Factory output fared no better and posted no change after an unrevised 0.3% August decline.
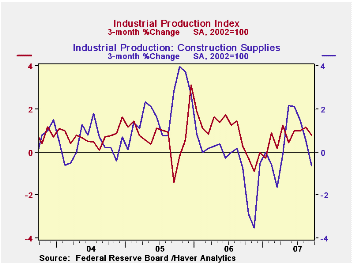
A 0.4% decline (+1.7% y/y) in the output of consumer goods led last month's decline in output. It mostly reflected a 2.8% (+1.7% y/y) drop in the production of automotive products. Output of appliances, furniture & carpeting showed no change but the 3.0% y/y decline reflected the continued weakness in the housing industry. Output of construction supplies fell 0.2% (-0.7% y/y) for the third consecutive monthly decline.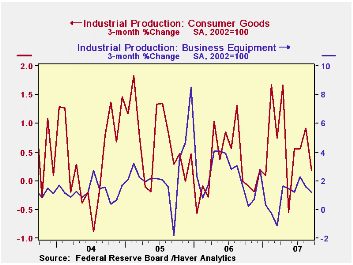
Returning to the consumer goods sector, production of computers & electronics rose 0.2% (13.8% y/y) after two consecutive monthly declines. Apparel output inched up 0.1% (-2.3% y/y) after the huge 2.0% drop during August. Chemical products output rose 0.5% (0.4% y/y).
Output of business equipment recovered all of the moderate August decline with a 0.5% (+4.1% y/y) rise. That increase was led by a 0.8% (9.0% y/y) gain in the output of information & processing equipment. Production of industrial equipment also rose a moderate 0.4% (1.4% y/y) but that only recovered a piece of the prior month's 1.2% drop.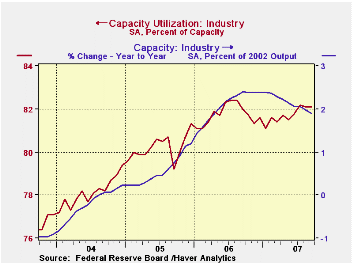
In the materials category, output increased 0.3% (2.1% y/y) but production of durable consumer parts fell 1.9% (-2.3% y/y). That decline was made up by 0.3% increases in the production of durable equipment parts (6.4% y/y) and other durable goods materials output (0.15 y/y) although the trends in these two sectors is very much down.
Capacity utilization was unchanged from August at 82.1%, up slightly from last year's average of 81.7%. Utilization in the factory sector fell m/m to 80.4% versus an average 80.5% last year. Capacity rose 0.1% (1.9% y/y).
The Recent Financial Turmoil and its Economic and Policy Consequences is yesterday's speech by Federal Reserve Board Chairman Ben S. Bernanke and it can be found here.
Financial Market Frictions from the Federal Reserve Bank of Atlanta is available here.
| INDUSTRIAL PRODUCTION (SA) | September | August | Y/Y | 2006 | 2005 | 2004 |
|---|---|---|---|---|---|---|
| Total | 0.1% | 0.0% | 2.0% | 4.0% | 3.2% | 2.5% |
| Manufacturing | 0.0% | -0.3% | 1.6% | 5.0% | 4.0% | 3.0% |
| Mining | 0.2% | -0.6% | 0.0% | 2.7% | -1.6% | -0.6% |
| Utilities | 0.0% | 4.6% | 6.5% | 0.2% | 2.0% | 1.4% |

Tom Moeller
AuthorMore in Author Profile »Prior to joining Haver Analytics in 2000, Mr. Moeller worked as the Economist at Chancellor Capital Management from 1985 to 1999. There, he developed comprehensive economic forecasts and interpreted economic data for equity and fixed income portfolio managers. Also at Chancellor, Mr. Moeller worked as an equity analyst and was responsible for researching and rating companies in the economically sensitive automobile and housing industries for investment in Chancellor’s equity portfolio. Prior to joining Chancellor, Mr. Moeller was an Economist at Citibank from 1979 to 1984. He also analyzed pricing behavior in the metals industry for the Council on Wage and Price Stability in Washington, D.C. In 1999, Mr. Moeller received the award for most accurate forecast from the Forecasters' Club of New York. From 1990 to 1992 he was President of the New York Association for Business Economists. Mr. Moeller earned an M.B.A. in Finance from Fordham University, where he graduated in 1987. He holds a Bachelor of Arts in Economics from George Washington University.
More Economy in Brief


