 Global| Oct 16 2007
U.S. Industrial Production Gain Minimal
by:Tom Moeller
|in:Economy in Brief
Summary
Industrial production nudged up minimally last month. The 0.1% rise followed no change in August. The September gain matched Consensus expectations. Factory output fared no better and posted no change after an unrevised 0.3% August [...]
Industrial production nudged up minimally last month. The 0.1% rise followed no change in August. The September gain matched Consensus expectations.
Factory output fared no better and posted no change after an unrevised 0.3% August decline.
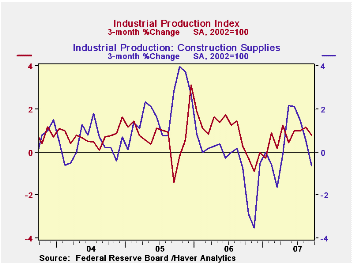
A 0.4% decline (+1.7% y/y) in the output of consumer goods led last month's decline in output. It mostly reflected a 2.8% (+1.7% y/y) drop in the production of automotive products. Output of appliances, furniture & carpeting showed no change but the 3.0% y/y decline reflected the continued weakness in the housing industry. Output of construction supplies fell 0.2% (-0.7% y/y) for the third consecutive monthly decline.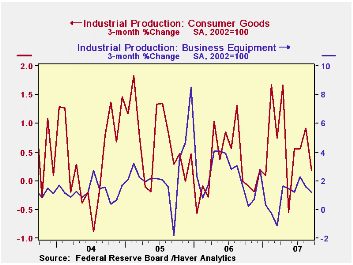
Returning to the consumer goods sector, production of computers & electronics rose 0.2% (13.8% y/y) after two consecutive monthly declines. Apparel output inched up 0.1% (-2.3% y/y) after the huge 2.0% drop during August. Chemical products output rose 0.5% (0.4% y/y).
Output of business equipment recovered all of the moderate August decline with a 0.5% (+4.1% y/y) rise. That increase was led by a 0.8% (9.0% y/y) gain in the output of information & processing equipment. Production of industrial equipment also rose a moderate 0.4% (1.4% y/y) but that only recovered a piece of the prior month's 1.2% drop.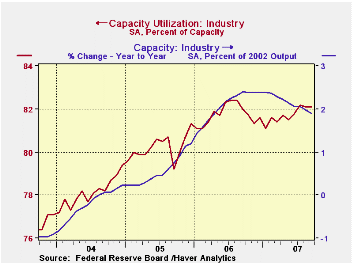
In the materials category, output increased 0.3% (2.1% y/y) but production of durable consumer parts fell 1.9% (-2.3% y/y). That decline was made up by 0.3% increases in the production of durable equipment parts (6.4% y/y) and other durable goods materials output (0.15 y/y) although the trends in these two sectors is very much down.
Capacity utilization was unchanged from August at 82.1%, up slightly from last year's average of 81.7%. Utilization in the factory sector fell m/m to 80.4% versus an average 80.5% last year. Capacity rose 0.1% (1.9% y/y).
The Recent Financial Turmoil and its Economic and Policy Consequences is yesterday's speech by Federal Reserve Board Chairman Ben S. Bernanke and it can be found here.
Financial Market Frictions from the Federal Reserve Bank of Atlanta is available here.
| INDUSTRIAL PRODUCTION (SA) | September | August | Y/Y | 2006 | 2005 | 2004 |
|---|---|---|---|---|---|---|
| Total | 0.1% | 0.0% | 2.0% | 4.0% | 3.2% | 2.5% |
| Manufacturing | 0.0% | -0.3% | 1.6% | 5.0% | 4.0% | 3.0% |
| Mining | 0.2% | -0.6% | 0.0% | 2.7% | -1.6% | -0.6% |
| Utilities | 0.0% | 4.6% | 6.5% | 0.2% | 2.0% | 1.4% |
by Tom Moeller October 16, 2007
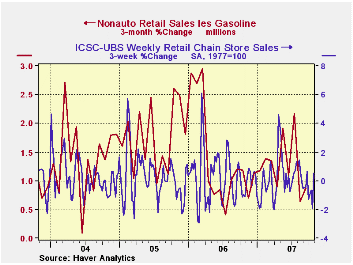
The ICSC-UBS retail chain-store sales index is constructed using the same-store sales (stores open for one year) reported by 78 stores of seven retailers: Dayton Hudson, Federated, Kmart, May, J.C. Penney, Sears and Wal-Mart.
The leading indicator of chain store sales from ICSC-UBS rose 0.2% (-0.3% y/y) after a 0.9% decline during the prior week.
| ICSC-UBS (SA, 1977=100) | 10/13/07 | 10/06/07 | Y/Y | 2006 | 2005 | 2004 |
|---|---|---|---|---|---|---|
| Total Weekly Chain Store Sales | 480.0 | 475.3 | 2.5% | 3.3% | 3.6% | 4.7% |
by Louise Curley October 16, 2007
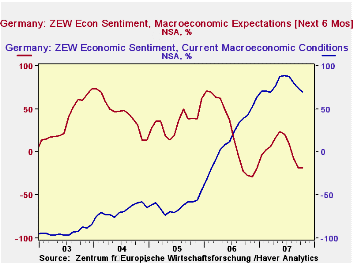
Contrary to expectations, the excess of pessimists over optimists among German institutional investors and analysts who participate in the ZEW survey did not increase in October but remained at 18.1%. The German financial types are still less pessimistic than they were a year ago in October 2006 when the excess of pessimists over optimists was 27.4%. Although less optimistic in October than in the peak of 88.7% in June, these financial types were still very optimistic concerning current macroeconomic conditions with optimists exceeding pessimists by 70.2%. The percent balances for expectations and for the appraisals of current conditions are shown in the first chart.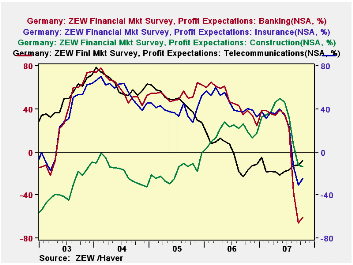
In the survey, participants are asked to appraise the outlook for profits in some 13 industries. Profit expectations for the banking, insurance and construction industries were especially hard hit as a result of the US sub prime mortgage problem and its ramifications. Profit expectation in the banking industry went from an excess of optimists over pessimists of 21.0% in July to excesses of pessimists over optimists of 37.3% in August and 65.9% in September. Corresponding figures for the insurance industry were +23.7%, -13.2% and -30.8% and for the construction industry, 32.3%, 6.2%, -12.1%. Profit expectations in the banking and insurance industries improved slightly in October but were still in negative territory. Profit expectations in the construction industry deteriorated further in October. Profit expectations for the banking, insurance and construction industries are shown in the second chart together with profits in the telecommunication industry, the other industry for which profit expectations are negative territory. The deterioration in expectations for profits in the telecommunications industry has been going on since early 2004.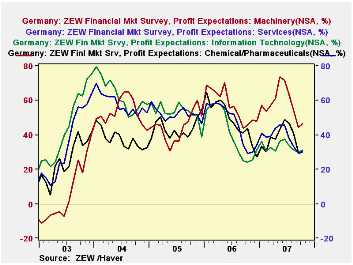
Even among those industries whose profits expectations are brightest, there have been declines in the excess of optimists over pessimists as can be seen in the third chart that shows the profit expectations of the machinery, services, information technology and chemical industries.
| ZEW SURVEY | Oct 07 | Sep 07 | Oct 06 | M/M Dif | Y/Y Dif | 2006 | 2005 | 2004 |
|---|---|---|---|---|---|---|---|---|
| Expectations Next 6 Months (% balance) |
-18.1 | -18.1 | -27.4 | 0.0 | -9.3 | 22.3 | 34.8 | 44.6 |
| Current Conditions (% balance) | 70.2 | 74.4 | 42.9 | -4.2 | 27.3 | 18.3 | -61.8 | -67.7 |
| Profit Expectations Next 6 Months | Oct 07 | Sep 07 | Aug 07 | Jul 07 | Jun 07 | May 07 | ||
| Banking (% balance) | -60.6 | -65.9 | -37.3 | 21.0 | 35.0 | 39.2 | ||
| Insurance (% balance) | -24.4 | -30.8 | -13.2 | 23.7 | 33.8 | 39.7 | ||
| Construction (% balance) | -13.5 | -12.1 | 6.2 | 32.3 | 46.5 | 49.8 | ||
| Telecommunications (% balance) | -7.8 | -11.7 | -12.7 | -16.2 | -17.5 | -21.2 | ||
| Machinery (% balance) | 46.5 | 44.3 | 54.6 | 63.5 | 71.6 | 73.4 | ||
| Information Technology (% balance) | 30.9 | 30.4 | 31.3 | 34.0 | 37.5 | 36.4 | ||
| Chemicals (% balance) | 30.8 | 29.7 | 41.2 | 46.9 | 48.9 | 43.2 | ||
| Services (% balance) | 30.3 | 29.4 | 33.4 | 37.9 | 45.5 | 45.4 |
by Robert Brusca October 16, 2007
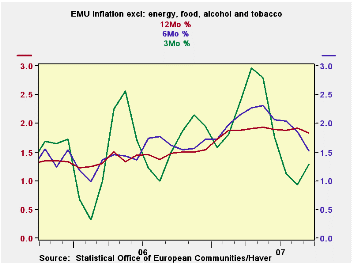
The inflation trends for EMU-13 core inflation excluding sin (alcohol and tobacco) shows a fairly well-behaved series. The six-month rate of inflation on this basis is still diving with the recent six-month pace at about 1.5%. Three-month inflation is even lower, below 1.5% but with some upward pressure. Year-over-year, core -X-sin inflation has plateaued and is showing signs of turning lower. These trends are at odds with the headline HICP which has popped up above the 2% mark, something the ECB will not like.
Over 12 months most of the main EMU indexes are over 2% and the two main EMU countries have headlines and core inflation rates pacing above 2% over the last 12 months. But the three-month inflation trends do NOT echo these pressures.
While the 12-month rates get most of the headlines the shorter-term gauges give us a better sense of what is happening now at the cost of somewhat greater volatility (less reliability). All of this is subverted, however, by the recent and new spurt in energy prices. Crude oil at $88/bbl poses some additional upside risks and could wreak havoc on existing trends - even core trends.
But what are these pressures? In the case of a product with inelastic demand like oil, the pressures are two fold. There is pressure on prices. But there is also an impact on consumer budgets, since inelastic demand that consumers cannot easily shift away form this item with its rising cost. Energy conservation is a concept that plays out over years and only prices are perceived to have risen and to have become sticky at a high point bringing about an economy wide response (demand side and supply side). And that is why oil prices, as well as being inflationary, are also deflationary.
As consumers commit more of their limited resources to energy, they have less to devote to other types of spending. In Europe with the euro running up at the same time, there is some respite from oil prices since oil is priced in dollars and the euro’s strength is keeping that cost pressure at bay. But the depressing impact of the euro mingles with whatever energy trends seep through.
For this reason Europe does not have the same degree of inflation risk as the dollar area, but even there inflation strains are not showing through. The dominant themes seem to be ‘things that subvert growth’. And that is the thing to watch in the months ahead more than the trend of the HICP, although money and credit growth trends will also continue to keep the ECB on edge.
| % mo/mo | % saar | ||||||
| Sep-07 | Aug-07 | Jul-07 | 3-Mo | 6-Mo | 12-Mo | Yr Ago | |
| EMU-13 | 0.4% | 0.0% | 0.1% | 1.8% | 2.5% | 2.1% | 1.7% |
| Core | 0.2% | 0.2% | 0.1% | 2.1% | 2.0% | 2.0% | 1.5% |
| Goods | 1.0% | 0.0% | -1.0% | 0.1% | 2.2% | 1.9% | 1.6% |
| Services | -0.5% | 0.2% | 0.8% | 1.8% | 2.5% | 2.5% | 2.0% |
| HICP | |||||||
| Germany | 0.7% | -0.1% | 0.2% | 3.1% | 3.1% | 2.6% | 1.0% |
| France | 0.1% | 0.3% | 0.0% | 1.8% | 2.7% | 1.6% | 1.5% |
| Italy | 0.3% | 0.2% | -0.1% | 1.5% | 1.7% | 1.8% | 2.3% |
| Spain | 0.4% | 0.0% | 0.2% | 2.3% | 2.8% | 2.7% | 2.9% |
| Core:xFE&A | |||||||
| Germany | 0.3% | 0.1% | 0.2% | 2.4% | 2.6% | 2.3% | 0.8% |
| France | 0.1% | 0.3% | 0.0% | 2.0% | 2.0% | 1.6% | 1.2% |
| Italy | 0.4% | 0.2% | 0.0% | 2.3% | 1.8% | 1.8% | 2.0% |
| Spain | 0.2% | 0.3% | 0.2% | 3.0% | 2.7% | 2.6% | 3.0% |
by Robert Brusca October 16, 2007
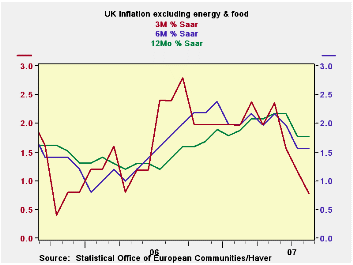
The chart on the left shows why there is talk of a BOE rate cut on the horizon. Not only are UK house prices losing their upward momentum, but inflation in the core HICP (excluding unprocessed food and energy) is showing sequentially lower rates of inflation.
Over the most recent three months, the headline HICP rate is actually negative. Over six months the rate of change in the HICP is only 0.6%. The BOE does not have an inflation range targeted but its main or headline gauge at 1.8% Yr/Yr is below its 2% mark. The core inflation rates are even lower and pointing to deceleration, sending a clear signal of inflation under control and possibly falling too rapidly.
| % MO/MO | % saar | ||||||
| Sep-07 | Aug-07 | Jul-07 | 3-MO | 6-MO | 12-MO | Yr Ago | |
| HICP | 0.1% | 0.1% | -0.3% | -0.4% | 0.6% | 1.7% | 2.4% |
| All Item RPI | 0.2% | 0.6% | -0.3% | 1.8% | 3.0% | 4.0% | 3.6% |
| RPIx | 0.2% | 0.3% | -0.3% | 0.8% | 1.9% | 2.8% | 3.2% |
| RPI excl Seasonally Adjusted Food | 0.2% | 0.5% | -0.2% | 1.9% | 2.9% | 3.9% | 3.6% |
| Food & Beverages | 1.2% | 0.6% | -0.9% | 4.0% | 5.0% | 4.2% | 3.4% |
| Housing and HH expenditures | 0.4% | 1.1% | -0.5% | 4.1% | 3.7% | 6.5% | 6.9% |
| Clothing & Footwear | -0.3% | -0.8% | 0.1% | -4.2% | -0.2% | -1.0% | -0.7% |
| Leisure Services | 0.4% | 0.6% | -0.1% | 3.8% | 2.4% | 3.4% | 2.5% |
| Leisure Goods | -0.3% | 0.3% | -0.1% | -0.4% | -3.9% | -3.2% | -1.5% |
| Motoring expenditures | -0.3% | -0.1% | -0.4% | -3.1% | 3.1% | 1.1% | -0.6% |
| Fares and travel costs | -3.6% | 1.6% | 0.0% | -8.0% | 2.9% | 6.0% | 0.2% |

Tom Moeller
AuthorMore in Author Profile »Prior to joining Haver Analytics in 2000, Mr. Moeller worked as the Economist at Chancellor Capital Management from 1985 to 1999. There, he developed comprehensive economic forecasts and interpreted economic data for equity and fixed income portfolio managers. Also at Chancellor, Mr. Moeller worked as an equity analyst and was responsible for researching and rating companies in the economically sensitive automobile and housing industries for investment in Chancellor’s equity portfolio. Prior to joining Chancellor, Mr. Moeller was an Economist at Citibank from 1979 to 1984. He also analyzed pricing behavior in the metals industry for the Council on Wage and Price Stability in Washington, D.C. In 1999, Mr. Moeller received the award for most accurate forecast from the Forecasters' Club of New York. From 1990 to 1992 he was President of the New York Association for Business Economists. Mr. Moeller earned an M.B.A. in Finance from Fordham University, where he graduated in 1987. He holds a Bachelor of Arts in Economics from George Washington University.
More Economy in Brief


