 Global| Mar 17 2008
U.S. Industrial Output Down
by:Tom Moeller
|in:Economy in Brief
Summary
Industrial production fell 0.5% last month after an unrevised 0.1% rise during January. The decline was greater than the 0.1% slip that was generally expected. The cause of the surprise, however, primarily was due to a 3.7% drop in [...]
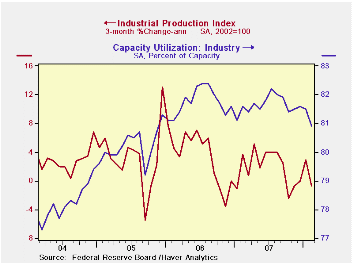
Industrial production fell 0.5% last month after an unrevised 0.1% rise during January. The decline was greater than the 0.1% slip that was generally expected. The cause of the surprise, however, primarily was due to a 3.7% drop in utility output, caused by warm Winter temperatures during February.
Factory output fell 0.3% during February. A reading of no change in January production was revised down from a 0.1% uptick reported initially. The m/m decline was the first since October and three month growth in output fell to -0.7% (AR). Production in the high tech sector rose 1.1% last month after a 0.3% January increase. Outside the high tech sector, factory output fell 0.4% during February after having been unchanged during January. Three month output growth fell to -1.1% (AR).
Production of computers & electronics again surged last month by 1.2% and three month growth totaled a strong 12.3%.
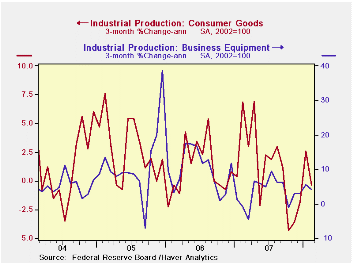
Severe weakness has taken over output elsewhere in the durable goods area. Output of furniture & appliances fell 3.1% last month after a 2.5% January decline. Three month output growth here fell to -25.4% at an annual rate. Output of automotive products dropped 1.2% and on a three month basis fell 6.2%. In the nondurables sector apparel product output fell 0.4%, the second consecutive decline, though that followed a strong 2.4% December jump. On a three month basis output growth was a still firm 3.2%.
Output of business equipment ticked up 0.1% for the second month and three month growth totaled 4.2%. Output of industrial equipment less high tech slipped 0.1% with three month growth still positive at 3.9%.
Output of construction supplies fell 0.7% during February for the second consecutive month and three month growth remained negative at -3.7%.
Capacity utilization fell to 80.9%, its lowest level since late 2005. Utilization in the factory sector slipped to 79.3%, its lowest also since late 2005. Annual growth in capacity is estimated at 1.7% y/y for 2.1% in the factory sector.
Yesterday the Federal Reserve announced two initiatives to promote financial market liquidity and orderly market functioning. The text of the announcement can be found here.
| INDUSTRIAL PRODUCTION (SA) | February | January | Y/Y | 2007 | 2006 | 2005 |
|---|---|---|---|---|---|---|
| Total | -0.5 | 0.1 | 1.1 | 1.9 | 4.0 | 3.2 |
| Manufacturing | -0.3 | 0.0 | 1.7 | 1.9 | 4.7 | 3.9 |
| Utilities | -3.7 | 2.2 | -5.4 | 3.1 | 0.2 | 2.0 |
by Louise Curley March 17, 2008
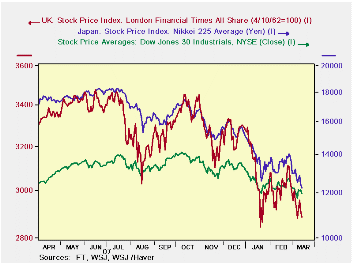
Stock markets around the world have taken another plunge as a
result of the latest turmoil in the financial markets. Peaks and
troughs in the stock markets have been successively lower ever since
the sub prime crisis erupted last August. The attached chart plots
daily stock price indexes for the United States (the Dow Jones), the
United Kingdom (the Financial Times All Share) and Japan (the Nikkei
225). As of last Friday, the Dow
Jones was down 15% from its July 19, 2007 peak of 14,000. The Financial
Times All Share was down 17% and the Nikkei 225, 33% from their peaks
of respectively 3,468 and 18,239 on July 13, 2007. Early indicators
suggests further falls today.
As of last Friday, the Dow
Jones was down 15% from its July 19, 2007 peak of 14,000. The Financial
Times All Share was down 17% and the Nikkei 225, 33% from their peaks
of respectively 3,468 and 18,239 on July 13, 2007. Early indicators
suggests further falls today.
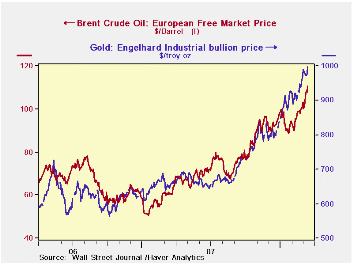
While stock markets been falling, commodity prices have been soaring. In attempts to seek safety, investors have turned to commodities, gold and oil in particular. The second chart shows the run ups in the prices of these commodities. Over the same period that the Dow Jones fell 15%, gold rose 47% and oil 43%.
These daily prices can be found in the Haver Data Base, INTDAILY.
| STOCK PRICE INDEXES | Mar 14,08 | Peak, Jul 07 | % Chg |
|---|---|---|---|
| U. S. Dow Jones | 11951.09 | 14000.41 | -14.64 |
| U.K. Financial Times All Shares | 2886.17 | 3467.92 | -16.78 |
| Japan Nikkei 225 Foreign | 12240.60 | 18238.95 | -32.88 |
| COMMODITY PRICES | |||
| Gold (Engelhard Indus Bullion $ per troy oz.) | 997.34 | 676.26 | 47.78 |
| Oil (Brent Crude $ per bbl.) | 110.75 | 78.33 | 41.39 |
by Tom Moeller March 17, 2008
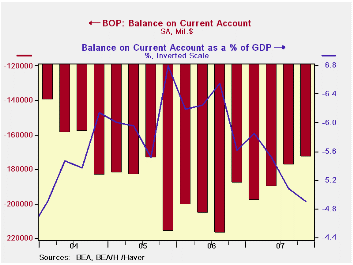
The US current account deficit fell last quarter to $172.9 billion from $177.4 billion in Q3. The Q4 deficit was shallower than Consensus expectations for a deficit of $184 billion.
The latest deficit totaled 4.9% of GDP and it peaked as a
percentage of GDP nearly two years ago at 6.8% in Q4 2005.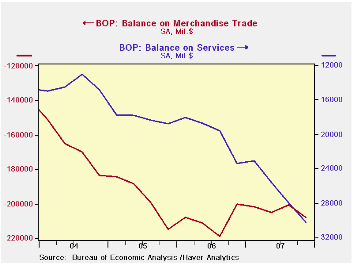
That shrinkage occurred even though the deficit on merchandise trade deepened. Higher oil prices lifted imports and the goods deficit grew to $208.1B from Q3's revised deficit of $200.5B. It was the deepest deficit in just over a year. During the last year only, however, exports grew 14.2% and outpaced import growth of 9.8%.
The effects of the lower U.S. dollar and the strength of foreign economies versus the U.S. is apparent greatest in the surplus in services trade which grew to a record surplus of $30.2B from $28.0B in 3Q. Exports of services during the last year grew 15.2%. Travel exports grew 21.4% y/y and passenger fares were up 19.2%. Imports grew a slower 11.5% due to moderate 7.3% growth in travel and 9.3% growth in passenger fares.
The trade surplus on earned income grew to $33.0B as the unilateral transfers deficit deepened to 28.1B.
Friedman and Taylor on Monetary Policy Rules: A
Comparison from the Federal Reserve Bank of St. Louis is
available
here.
| US Balance of Payments, Bil.$, SA | 4Q '07 | Q3 '07 | Year Ago | 2007 | 2006 | 2005 |
|---|---|---|---|---|---|---|
| Current Account Balance ($ Bil.) | -172.9 | -177.4 | -187.9 | -738.6 | -811.5 | -754.8 |
| Deficit % of GDP | -4.9 | -5.1 | -5.6 | -5.3 | -6.2 | -6.1 |
| Balance on Goods ($ Bil.) | -208.1 | -200.5 | -200.3 | -815.4 | -838.3 | -787.1 |
| Exports | 2.4% | 6.7% | 14.2% | 12.3% | 14.4% | 10.8% |
| Imports | 2.9% | 2.9% | 9.8% | 5.5% | 10.7% | 12.9% |
| Balance on Private Services ($ Bil.) | 30.2 | 28.0 | 23.4 | 106.9 | 79.8 | 72.8 |
| Exports | 4.4% | 4.9% | 15.2% | 13.4% | 8.8% | 11.1% |
| Imports | 3.4% | 3.7% | 11.5% | 8.6% | 9.3% | 8.7% |
| Balance on Income ($ Bil.) | 33.0 | 21.3 | 9.7 | 74.3 | 36.6 | 48.1 |
| Unilateral Transfers ($ Bil.) | -28.1 | -26.2 | -20.7 | -104.4 | -89.6 | -88.5 |

Tom Moeller
AuthorMore in Author Profile »Prior to joining Haver Analytics in 2000, Mr. Moeller worked as the Economist at Chancellor Capital Management from 1985 to 1999. There, he developed comprehensive economic forecasts and interpreted economic data for equity and fixed income portfolio managers. Also at Chancellor, Mr. Moeller worked as an equity analyst and was responsible for researching and rating companies in the economically sensitive automobile and housing industries for investment in Chancellor’s equity portfolio. Prior to joining Chancellor, Mr. Moeller was an Economist at Citibank from 1979 to 1984. He also analyzed pricing behavior in the metals industry for the Council on Wage and Price Stability in Washington, D.C. In 1999, Mr. Moeller received the award for most accurate forecast from the Forecasters' Club of New York. From 1990 to 1992 he was President of the New York Association for Business Economists. Mr. Moeller earned an M.B.A. in Finance from Fordham University, where he graduated in 1987. He holds a Bachelor of Arts in Economics from George Washington University.
More Economy in Brief


