 Global| May 27 2005
U.S. Income & Outlays Firm, Wage Revisions Upward
by:Tom Moeller
|in:Economy in Brief
Summary
Personal income in April rose 0.7% following a 0.5% increase in March. Consensus expectations had been for a 0.6% rise. Disposable personal income increased 0.5% (6.0% y/y) following two months of 0.4% gain. When adjusted for price [...]
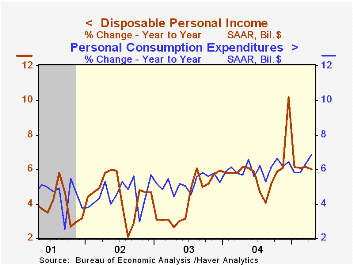
Personal income in April rose 0.7% following a 0.5% increase in March. Consensus expectations had been for a 0.6% rise. Disposable personal income increased 0.5% (6.0% y/y) following two months of 0.4% gain. When adjusted for price inflation take home pay rose 0.1% (3.3% y/y) following a slight decline in March.
Wages & salaries were notably strong and growth during the prior year was upwardly revised. A 0.7% April increase (7.6% y/y) doubled the prior months' increases and year to year growth through March was revised up to 7.6% from 5.8% y/y estimated earlier. Wages in service producing industries surged 0.9% and y/y growth rose to 9.2% versus the 6.4% pace previously estimated. Even factory sector wages showed life and rose 0.5% (6.4% y/y) in April. Year to year growth through March now stands at 7.0%, up from the 5.8% y/y gain estimated last month.
Offsetting some of this strength have been declines in rental income (-14.1% y/y).
Personal consumption increased 0.6% following an upwardly revised 0.9% increase in March. Consensus expectations had been for a 0.8% gain. Durable goods spending rose 0.7% (9.4% y/y) and spending on services rose 0.3% (5.6% y/y) following earlier gains that were revised down.
Nondurables spending surged 1.1% (8.3% y/y) as spending on gasoline & oil jumped 5.5% (25.9% y/y). Spending on clothing recovered 1.5% (5.9% y/y) following the prior month's 2.1% drop.
The PCE chain price index rose 0.4% but less food & energy the 0.1% m/m increase was the slimmest of the year.
| Disposition of Personal Income | April | March | Y/Y | 2004 | 2003 | 2002 |
|---|---|---|---|---|---|---|
| Personal Income | 0.7% | 0.5% | 7.0% | 5.8% | 3.2% | 1.8% |
| Personal Consumption | 0.6% | 0.9% | 6.9% | 6.0% | 5.2% | 4.6% |
| Savings Rate | 0.4% | 0.5% | 1.5% | 1.3% | 1.4% | 2.0% |
| PCE Chain Price Index | 0.4% | 0.5% | 2.7% | 2.2% | 1.9% | 1.4% |
| Less food & energy | 0.1% | 0.3% | 1.6% | 1.5% | 1.3% | 1.8% |
by Tom Moeller May 27, 2005
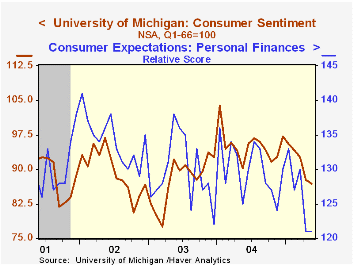
The University of Michigan's reading of consumer sentiment for all of May did fall 0.9% from the prior month to 85.9 but that was better than the mid-month reading of a 2.7% decline. Consensus expectations had been for a level of 86.0.
Sentiment still is down in each of the last five months and is off 16.3% from the January '04 peak. During the last ten years there has been a 75% (inverse) correlation between the level of consumer sentiment and the y/y change in real PCE, although the correlation has fallen in recent years.
The reading of current economic conditions recovered late in the month and rose for the first full month since January. Buying conditions for large household goods recovered sharply.
Consumer expectations recovered though expectations about personal finances remained depressed.
The University of Michigan survey is not seasonally adjusted.The mid-month survey is based on telephone interviews with 250 households nationwide on personal finances and business and buying conditions. The survey is expanded to a total of 500 interviews at month end.
| University of Michigan | May | April | Y/Y | 2004 | 2003 | 2002 |
|---|---|---|---|---|---|---|
| Consumer Sentiment | 86.9 | 87.7 | -3.7% | 95.2 | 87.6 | 89.6 |
| Current Conditions | 104.9 | 104.4 | 1.3% | 105.6 | 97.2 | 97.5 |
| Consumer Expectations | 75.3 | 77.0 | -7.7% | 88.5 | 81.4 | 84.6 |
by Carol Stone May 27, 2005
British Bankers Association data on lending to individuals have recently been added to Haver's "UK" database. The April figures were reported today and updated by our "European shift", the manager and crew who work from roughly midnight in New York to 8:00AM.
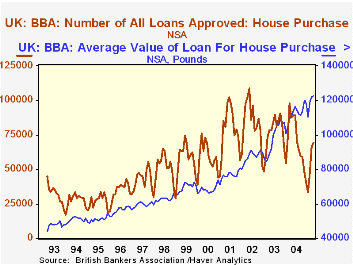
Gross new mortgage lending gave a tentative sign of stabilizing after a period of deep weakness during the winter. New loans totaled £14,120 million, up 2.9% from March, although still 12.6% below the April 2004 amount. The number of loans approved for house purchase, 69,323, was off 21.0% from a year ago, but this is the smallest 12-month decline since last August. Intervening months have seen 30%-40% rates of decline.
The average value of newly approved loans has been increasing, but more slowly in recent months. The April figures show a 10.7% rise from a year ago. This is stronger than several months of single-digit increases since last summer, but weaker than the 15%-20% gains prior to that. This general tapering trend is reflected in house prices, with the Halifax Standardised Price, for example, virtually flat for the first four months of 2005. The UK housing market appears to have cooled, and other data on the industry have turned in a mixed, basically indeterminate performance so far this year.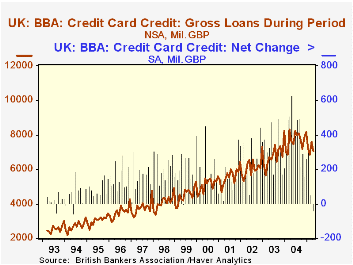
The BBA figures on consumer credit show weakness. The amount of new credit card debt was £7,064 million in April, down 7.2% from a year ago. More, the total amount of credit card debt outstanding fell by a seasonally adjusted £40 million in April, the first monthly decline since August 1994. The recent sluggishness coincides to a decline in UK retail sales of 2.7% in value since September.
The BBA lending data are cited in two sections of our UK database, both in "Financial Data" and also in "Housing and Construction". They cover several "major banking groups", the so-called "MBBG" and are styled to parallel some similar concepts reported by the Bank of England for all banks, building societies and other mortgage lenders. Those broader data are due for release on Wednesday 1 June.
| United Kingdom Mil.GBP (NSA except where noted) |
Apr 2005 | Mar 2005 | Feb 2005 | Year Ago | Monthly Averages|||
|---|---|---|---|---|---|---|---|
| 2004 | 2003 | 2002 | |||||
| Gross New Loans | 14,120 | 13,721 | 11,938 | 16,150 | 15,701 | 15,071 | 12,586 |
| Loan Approvals- Number | 69,323 | 65,635 | 47,365 | 87,800 | 69,244 | 76,105 | 83,915 |
| - Average Value (£) | 122,700 | 121,600 | 119,000 | 110,800 | 112,083 | 97,817 | 87,367 |
| - 12-mo. % change | 10.7 | 14.6 | 12.0 | 14.3 | |||
| Credit Card Debt- Gross | 7,064 | 7,586 | 6,842 | 7,610 | 7,707 | 6,818 | 6,105 |
| - Outstanding EOP | 34,015 | 33,628 | 33,728 | 31,139 | 33,973 | 28,689 | 26,409 |
| - Net Change SA | -40 | 134 | 50 | 388 | 310 | 266 |

Tom Moeller
AuthorMore in Author Profile »Prior to joining Haver Analytics in 2000, Mr. Moeller worked as the Economist at Chancellor Capital Management from 1985 to 1999. There, he developed comprehensive economic forecasts and interpreted economic data for equity and fixed income portfolio managers. Also at Chancellor, Mr. Moeller worked as an equity analyst and was responsible for researching and rating companies in the economically sensitive automobile and housing industries for investment in Chancellor’s equity portfolio. Prior to joining Chancellor, Mr. Moeller was an Economist at Citibank from 1979 to 1984. He also analyzed pricing behavior in the metals industry for the Council on Wage and Price Stability in Washington, D.C. In 1999, Mr. Moeller received the award for most accurate forecast from the Forecasters' Club of New York. From 1990 to 1992 he was President of the New York Association for Business Economists. Mr. Moeller earned an M.B.A. in Finance from Fordham University, where he graduated in 1987. He holds a Bachelor of Arts in Economics from George Washington University.
More Economy in Brief


