 Global| Dec 14 2006
U.S. Import Prices Up
by:Tom Moeller
|in:Economy in Brief
Summary
Overall import prices increased 0.2% last month following two months of sharp decline and compared to Consensus expectations for no change. The increase occurred despite a 1.6% decline in the prices of petroleum imports after [...]
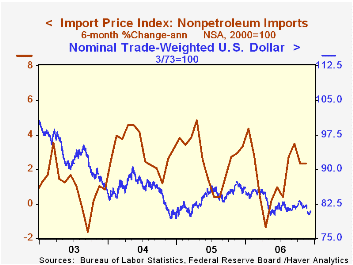
Overall import prices increased 0.2% last month following two months of sharp decline and compared to Consensus expectations for no change.
The increase occurred despite a 1.6% decline in the prices of petroleum imports after October's 10.1% plunge, which was deeper than initially reported. So far in December the price of Brent crude oil has risen roughly four dollars from the $59.36 per bbl. averaged in November.
Less petroleum import prices reversed the October decline with a 0.7% increase. During the last ten years there has been a 66% (negative) correlation between the nominal trade-weighted exchange value of the US dollar vs. major currencies and the y/y change in non oil import prices. The correlation is a lower 47% against a broader basket of currencies.
Prices for nonoil industrial supplies & materials reversed all of the prior month's decline with a 2.9% (1.7% y/y) increase. Prices for nondurables less petroleum jumped 6.5% (-10.9% y/y) in November following several months of decline this year. Prices for durable industrial supplies & materials (14.7% y/y) were strong early this year but m/m price gains have evaporated. These prices are unchanged since June.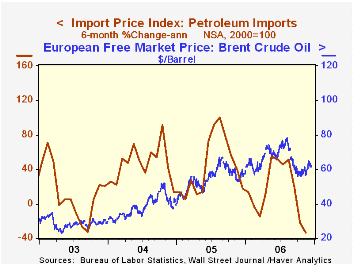
Capital goods prices were unchanged for the fourth straight month (0.2% y/y) and excluding a 0.1% (-3.6% y/y) increase in computers, capital goods prices also were unchanged (2.0% y/y) in November. Prices for nonauto consumer goods additionally were unchanged (1.1% y/y).
Export prices rose 0.4% after two months of decline as nonagricultural commodities prices ticked up 0.1% (3.4% y/y) and agricultural export prices surged 4.4% (10.4% y/y).
The Adjustment of Global External Imbalances: Does Partial Exchange Rate Pass-through to Trade Prices Matter? from the Federal Reserve Board is available here.
The Internationalization of the Dollar and Trade Balance Adjustment from the Federal Reserve Bank of New York can be found here.
| Import/Export Prices (NSA) | November | October | Y/Y | 2005 | 2004 | 2003 |
|---|---|---|---|---|---|---|
| Import - All Commodities | 0.2% | -2.3% | 1.2% | 7.5% | 5.6% | 2.9% |
| Petroleum | -1.6% | -10.1% | 1.5% | 37.6% | 30.5% | 21.0% |
| Non-petroleum | 0.7% | -0.5% | 1.3% | 2.7% | 2.6% | 1.1% |
| Export- All Commodities | 0.4% | -0.3% | 3.9% | 3.2% | 3.9% | 1.6% |
by Tom Moeller December 14, 2006
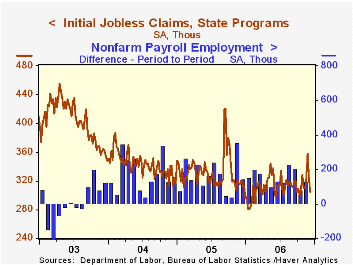
Initial unemployment insurance claims fell a sharp 20,000 last week to 304,000 following an unrevised 34,000 drop during the prior week. The decline was to the lowest level since mid-October and by far surpassed Consensus expectations for a slight decline to 320,000 claims.
During the last ten years there has been a (negative) 77% correlation between the level of initial claims and the m/m change in nonfarm payroll employment.
The four-week moving average of initial claims eased slightly to 327,750 (+2.6% y/y).
Continuing claims for unemployment insurance fell 33,000 after a downwardly revised 43,000 increase during the prior week.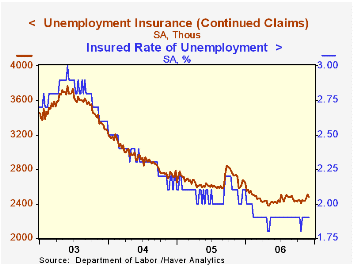
Beyond the Outsourcing Angst: Making America More Productive from the Federal Reserve Bank of Dallas can be found here.
How Labor Market Policies Shape Immigrants’ Opportunities, also from the Federal Reserve Bank of Dallas, is available here.
| Unemployment Insurance (000s) | 12/09/06 | 12/02/06 | Y/Y | 2005 | 2004 | 2003 |
|---|---|---|---|---|---|---|
| Initial Claims | 304 | 324 | -5.3% | 332 | 343 | 403 |
| Continuing Claims | -- | 2,477 | -4.5% | 2,662 | 2,924 | 3,532 |
by Carol Stone December 14, 2006
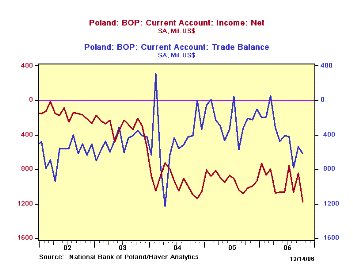
Four Central European countries reported their October current account results during the day yesterday, December 13. Yesterday in this commentary, we noted that the improvement in Japan's surplus in the month resulted from lower petroleum imports, which were augmented by complementary advances in other current account components. Today, we see that for Poland, Bulgaria, Slovenia and Serbia, developments in those other current account items – services, income and transfers – helped during the summer to mitigate the impact on the current account of larger petroleum imports. But this counterbalance can't be counted on every month and sometimes such increases in merchandise trade deficits are enlarged.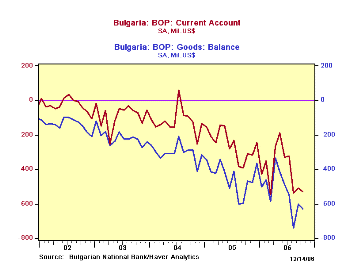
Poland is a good example: its current account deficit widened to $1.23 billion in October from just $82 million in September and $940 million a year ago. As seen in the graph, in most months, the trade portion is only about half the total current account balance. The deficit on income, particularly rising income payments abroad, make for a more complex current account situation.
In Bulgaria, the current account deficit has been steady the last three months at just over $500 million, even as imports of goods have fallen from their August peak of $2,139 million to $1,896 billion. Goods exports also fell and the net on services, generally a surplus in Bulgaria, declined to virtually zero. The moves are small, but they still indicate the intricacy of international trade and financial flows. 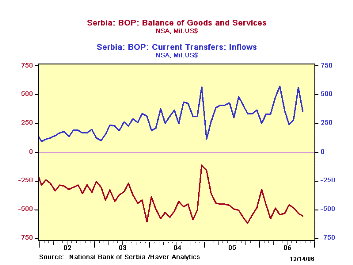
Serbia's current account position receives considerable support from transfer payments. As seen in the graph, the deficit on goods and services is heavily offset by transfer receipts. As we point out here, though, the flows do not come in lockstep, so in October transfers went down at the same time as the goods and services balance.
Finally in Slovenia, the trade deficit is offset to some degree by a continuing small surplus in services, although income accounts generally show net outflows and transfers are erratic in both directions.
| Current Account Balances: SA, Mil.$ |
Oct 2006 | Sept 2006 | Aug 2006 | Year-Ago | Monthly Averages|||
|---|---|---|---|---|---|---|---|
| 2005 | 2004 | 2003 | |||||
| Poland | -1,234 | -82 | -1,192 | -940 | -427 | -891 | -386 |
| Bulgaria | -527 | -509 | -539 | -311 | -255 | -122 | -87 |
| Serbia (NSA) | -330 | -132 | -334 | -344 | -174 | -244 | -161 |
| Slovenia | -58 | -271 | -92 | -33 | -56 | -74 | -18 |

Tom Moeller
AuthorMore in Author Profile »Prior to joining Haver Analytics in 2000, Mr. Moeller worked as the Economist at Chancellor Capital Management from 1985 to 1999. There, he developed comprehensive economic forecasts and interpreted economic data for equity and fixed income portfolio managers. Also at Chancellor, Mr. Moeller worked as an equity analyst and was responsible for researching and rating companies in the economically sensitive automobile and housing industries for investment in Chancellor’s equity portfolio. Prior to joining Chancellor, Mr. Moeller was an Economist at Citibank from 1979 to 1984. He also analyzed pricing behavior in the metals industry for the Council on Wage and Price Stability in Washington, D.C. In 1999, Mr. Moeller received the award for most accurate forecast from the Forecasters' Club of New York. From 1990 to 1992 he was President of the New York Association for Business Economists. Mr. Moeller earned an M.B.A. in Finance from Fordham University, where he graduated in 1987. He holds a Bachelor of Arts in Economics from George Washington University.
More Economy in Brief


