 Global| Jan 14 2009
U.S. Import Prices Down Sharply Again: Both Oil & Nonoil
by:Tom Moeller
|in:Economy in Brief
Summary
During December, total U.S. import prices declined another 4.2% after the revised 7.0% November drop. The decline fell short of Consensus expectations for a 5.3% decline. Petroleum prices continued down sharply last month by 21.4%. [...]
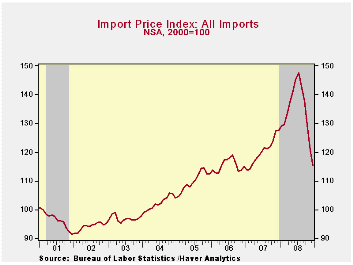
During December, total U.S. import prices declined another 4.2% after the revised 7.0% November drop. The decline fell short of Consensus expectations for a 5.3% decline.
Petroleum prices continued down sharply last month by 21.4%. However, a recent turnaround has lifted imported oil prices by 9.0% versus the December average.
December import prices less petroleum were down for the fifth straight month. The 1.1% decline lowered them by 13.6% (AR) during the last three months versus the 12%-to-13% rates of positive growth this past spring.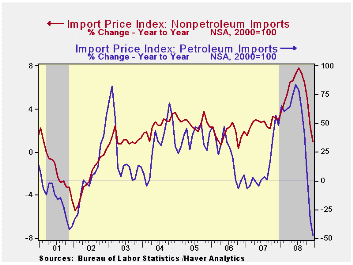
December-to-December, the foreign exchange value of the dollar rose 9.3% and thus reduced the change in U.S. import prices. During the last ten years there has been an 83% (negative) correlation between the nominal trade-weighted exchange value of the US dollar vs. major currencies and the y/y change in non oil import prices.
Capital goods import prices fell another 0.3% and on a three-month basis prices fell at a 3.4% annual rate after a 5%-to-6% rate of increase earlier this year. Less the lower prices of computers, capital goods prices fell 0.2% and the three-month growth rate fell to 1.8% rate over the last three months after 9.0% growth earlier this year. Prices of computers, peripherals & accessories were down at an 8.1% rate during the last three months.
Prices for nonauto consumer goods ticked up 0.1% last month but the three-month rate of change remained a negative 0.8% versus the 5.9% peak earlier this year. Durable goods prices overall fell at a 0.8% rate during the last three months versus a 6.2% rate of increase earlier this year.
Total export prices fell 2.3% due to another sharp decline in agricultural prices. Their 6.5% drop left them down at a 60.2% annual rate during the last three months. Nonagricultural export prices by 1.9% for the fifth consecutive monthly decline.
Troubled Asset Relief Program is yesterday's testimony by Fed Vice-Chairman Donald L. Kohn and it is available here.
| Import/Export Prices (NSA, %) | December | November | Y/Y | 2008 | 2007 | 2006 |
|---|---|---|---|---|---|---|
| Import - All Commodities | -4.2 | -7.0 | -9.3 | 11.6 | 4.2 | 4.9 |
| Petroleum | -21.4 | -28.5 | -47.0 | 38.3 | 11.6 | 20.6 |
| Nonpetroleum | -1.1 | -1.8 | 0.9 | 5.3 | 2.7 | 1.7 |
| Export- All Commodities | -2.3 | -3.4 | -3.2 | 6.0 | 4.9 | 3.6 |

Tom Moeller
AuthorMore in Author Profile »Prior to joining Haver Analytics in 2000, Mr. Moeller worked as the Economist at Chancellor Capital Management from 1985 to 1999. There, he developed comprehensive economic forecasts and interpreted economic data for equity and fixed income portfolio managers. Also at Chancellor, Mr. Moeller worked as an equity analyst and was responsible for researching and rating companies in the economically sensitive automobile and housing industries for investment in Chancellor’s equity portfolio. Prior to joining Chancellor, Mr. Moeller was an Economist at Citibank from 1979 to 1984. He also analyzed pricing behavior in the metals industry for the Council on Wage and Price Stability in Washington, D.C. In 1999, Mr. Moeller received the award for most accurate forecast from the Forecasters' Club of New York. From 1990 to 1992 he was President of the New York Association for Business Economists. Mr. Moeller earned an M.B.A. in Finance from Fordham University, where he graduated in 1987. He holds a Bachelor of Arts in Economics from George Washington University.
More Economy in Brief


