 Global| May 16 2007
U.S. Housing Starts Rise, Permits Fall
Summary
Starts rise by 2.5% after downward revision of 1.8% still a net rise on month. Permits fall by 8.9% - drops in all regions. Starts are off by 16.1% year/year compared to permits that are off by 28.1%. Builders hack permits to get them [...]
Starts rise by 2.5% after downward revision of 1.8% still a net rise on month.
Permits fall by 8.9% - drops in all regions.
Starts are off by 16.1% year/year compared to permits that are off by 28.1%.
Builders hack permits to get them in better alignment with starts.
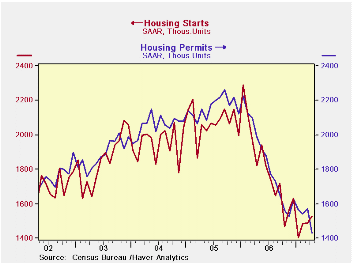
Permits fell across the board in April and fell sharply. But starts advanced, rising by 2.5% in the month after a downward revision to the prior month. Starts are much weaker year/year than are permits, pointing to a dampening in activity ahead.
While the sharp drop in permits is disturbing, permits have little explanatory power for future starts. The chart shows a clear tendency for the level of starts to coalesce around current levels over the past seven months. It is unclear if the drop in permits in April is to arrest a stock pile of permits that had grown too large for builders or if there are real plans being cut back that affect actual starts even more in the months ahead. The chart speaks to a pause in the rate of descent. Both starts and permits have paused for the last several months now. Starts and permit trends are diverging - at least for one month.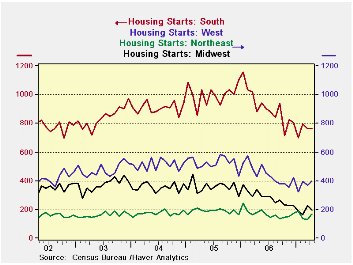
The regional patterns of housing starts are likewise rather docile. They show slow declines are in force with scattered evidence of some turbulence in the recent observations that create a path of stability around current levels in recent months. The Midwest has already bounced and showed some sense of trying to stabilize. The Northeast is also turning higher amid some considerable volatility. A more moderate ‘sustained rise’ appears in train in the South. The West looks more like it has hit a two-month plateau or that it is in a very gradual upturn. The growth statistics over fixed horizons exaggerate or even dismiss some of these trends. On balance if the permits data are signaling new weakness it is coming out of the blue and is not tipped off by past trends in starts. The history of this time series does NOT suggest that that is the way it works. Permits are the slave, not the master.
As builders became optimistic during the housing boom, they had acquired permits at a pace faster than starts. Evidence is therefore consistent with the notion that builders have plenty of slack in permits and are trying to reduce them more to coincide with the reasonable future levels of starts. In January the ratio of permits to starts was the fifth highest since January 1985. In Feb that slipped to the 49th rank (out of 266); in April the ranking is 222 out of 268, more appropriate for these times.
| Apr 2007 | % Change at Ann Rate | ||
| Regional Trends | 3-Mo | 6-Mo | 1-Yr |
| Northeast | -34.0% | 34.0% | -4.4% |
| Midwest | 8.4% | -32.8% | -42.6% |
| South | 36.6% | 14.0% | -13.0% |
| West | 89.6% | 11.1% | -6.3% |
by Robert Brusca May 16, 2007
Industrial production is up strongly at the start of Q2 2007 and its lift is across the aboard. Vehicle output is strong. But output is strong apart from vehicles as well. Consumer product output is also strong and business equipment is strengthening sharply. All the signs of increased output are good except that domestic demand does not seem to be there to support it. Since inventories have been in a contracting/control mode (except in manufacturing where inventories have seemed to bloat further even as shipments have sagged). What does this surge in output really mean? Either the US is gaining trade competitiveness or the consumer will bail producers out by accelerating spending or what we see is evidence of more unneeded inventories being created.
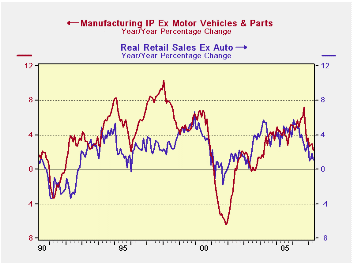
The big picture shows retail spending excluding autos correlates pretty well with industrial production excluding vehicles. Unfortunately both are showing declining trends even with this strong April output report factored in.
We can also look at consumer spending and output separate from capital goods. When we go behind the scenes to that level of detail, we see some evidence of a correlation between consumer spending and the output of consumer goods. But we still see the consumer spending is declining year/year and so is the output of consumer goods despite this month’s output surge.
Turning to capital spending, capital spending by itself is still slowing (y/y) even with this month’s strong rise in output. While durable goods orders (ex aircraft) are still very volatile, capital spending tracks its erratic trend with a lag. Both spending and orders are pointing to weaker performance ahead.Summing up…on balance, the NEWS on industrial production is reassuring by itself. After all producers do the things they do for a reason. But, for the moment we do not know what that is. Year/year consumer trends are slowing and capital spending plans are slowing as well. The rise in output in April only boosts the year/year industrial production growth rate to the point that it stays in a withering trend. Unless the U.S. is benefiting from a surge in trade (exports) that is not yet present in data, the rise in output this month is mostly a mystery.
| 3-Month | 6-Month | Year/Year | Y/Y Yr Ago | |
| Industrial Output | % Change | % Change | % Change | % Change |
| All Prod&Materials | 4.7% | 1.8% | 1.9% | 4.4% |
| All Products | 5.4% | 2.5% | 2.2% | 4.5% |
| Final Products | 6.4% | 3.7% | 3.0% | 4.7% |
| MFG-NAICS | 4.5% | 3.0% | 2.0% | 5.9% |
| MFG-Durables | 7.9% | 4.0% | 2.7% | 9.6% |
| MFG-Nondurables | 0.7% | 1.9% | 1.3% | 1.7% |
| Consumer Goods | 7.1% | 3.7% | 2.3% | 2.3% |
| Business Equipment | 9.0% | 5.1% | 5.7% | 12.7% |
| Materials | 4.3% | 0.9% | 1.4% | 4.4% |
| Capacity Use Level | 81.5 | 81.4 | 81.7 | 80.7 |
by Carol Stone May 16, 2007
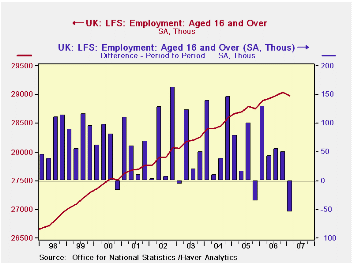
Employment in the UK fell by 1,000 in the February period, a third successive monthly decrease in this 3-month moving average. Over the last three months (the style of comparison that the UK's Office for National Statistics [ONS] generally emphasizes) employment was down by 55,000 and reached the lowest monthly level since last June. Notably, though, full-time work has held virtually steady October, and it is part-time work that has been cut.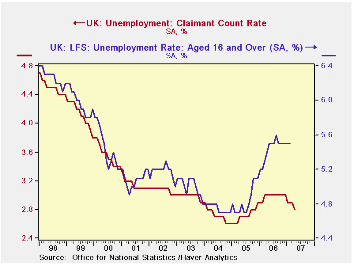
The unemployment rate, measured by the ILO definition, has held flat at 5.5% since September, and in fact, with the exception of a 5.6% reading last August, has been 5.5% since last May, again using a 3-month moving average. The number unemployed has hovered close around 1.7 million. At the same time, the more popular unemployment gauge in the UK, the "claimant count rate", has edged lower. In April, this rate, reported as a figure covering just a single month, was 2.8%, down from 2.9% in March and 3.0% during nearly all of 2006.The number of "claimants" for April was 890,000, the first dip below 900,000 since October 2005. At least one press report today argued that the improvement in these latter jobless statistics would give the Bank of England room to raise interest rates in coming months to keep inflation down. However, another press service noted a modest slowing in earnings growth, which would limit the Bank's need to act.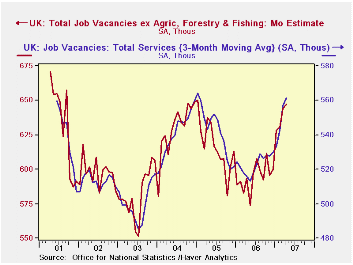
Job vacancies suggest that the employment environment may do better. Reported vacancies amounted to 647,400 in April, up 20,000 from three months ago. The clearest gains appear in wholesale & retail trade, hotels and restaurants and in public services, such as health care. The financial sector is also on a steady, but more gradual uptrend. Manufacturing even has seen some increase. Thus, despite the flat pattern in the broad employment measure, these vacancy data point toward some improvement.
| UK Labor Force Survey & Related Labor Data | Jan 2007 | Dec 2006 | Nov 2006 | Oct 2006 | Year Ago | 2006 | 2005 | 2004 |
|---|---|---|---|---|---|---|---|---|
| Employment* (3Mo Avg, SA, Thous) |
-- | -- | 28,981 | 28,982 | 28,887 | 28,960 | 28,730 | 28,465 |
| Chg from 1 & 3 Months Ago | -- | -- | -1/-44 | -40/-47 | +8 (MoAvg)0.3% y/y |
0.8% | 0.9% | 1.0% |
| Unemployment Rate* (3Mo Avg, SA, %) |
-- | -- | 5.5% | 5.5% | 5.2% | 5.4% | 4.8% | 4.8% |
| Claimant Count (Monthly, Thous) |
890.0 | 905.7 | 920.0 | 923.1 | 947.1 | 944.7 | 861.7 | 853.3 |
| Claimant Count Rate (SA, %) | 2.8 | 2.9 | 2.9 | 2.9 | 3.0 | 3.0 | 2.7 | 2.7 |
| Vacancies (Monthly, Thous) | 637.7 | 602.8 | 590.7 | 619.1 | 598.8 | 599.4 | 618.6 | 631.9 |

Robert Brusca
AuthorMore in Author Profile »Robert A. Brusca is Chief Economist of Fact and Opinion Economics, a consulting firm he founded in Manhattan. He has been an economist on Wall Street for over 25 years. He has visited central banking and large institutional clients in over 30 countries in his career as an economist. Mr. Brusca was a Divisional Research Chief at the Federal Reserve Bank of NY (Chief of the International Financial markets Division), a Fed Watcher at Irving Trust and Chief Economist at Nikko Securities International. He is widely quoted and appears in various media. Mr. Brusca holds an MA and Ph.D. in economics from Michigan State University and a BA in Economics from the University of Michigan. His research pursues his strong interests in non aligned policy economics as well as international economics. FAO Economics’ research targets investors to assist them in making better investment decisions in stocks, bonds and in a variety of international assets. The company does not manage money and has no conflicts in giving economic advice.
More Economy in Brief


