 Global| Feb 17 2010
U.S. Housing Starts Rise ButForward Momentum Is Weak
by:Tom Moeller
|in:Economy in Brief
Summary
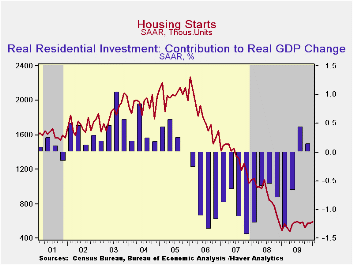
Housing starts increased a modest 2.8% last month to 591,000 (AR) units following a slightly revised decline to 575,000 during December. The small gain was only enough, however, to lift starts back to the level reached last summer. In [...]
 Housing
starts increased a modest 2.8% last month to 591,000 (AR) units
following a slightly revised decline to 575,000 during December. The
small gain was only enough, however, to lift starts back to the level
reached last summer. In fact, the 21.1% twelve-month increase from near
the recession low pales in comparison to the 50%-90% increases
following downturns since the 1970s. Since their peak in January of
2006, starts remain down by three-quarters. January's figure slightly
beat Consensus expectations for 580,000 starts.
Housing
starts increased a modest 2.8% last month to 591,000 (AR) units
following a slightly revised decline to 575,000 during December. The
small gain was only enough, however, to lift starts back to the level
reached last summer. In fact, the 21.1% twelve-month increase from near
the recession low pales in comparison to the 50%-90% increases
following downturns since the 1970s. Since their peak in January of
2006, starts remain down by three-quarters. January's figure slightly
beat Consensus expectations for 580,000 starts.
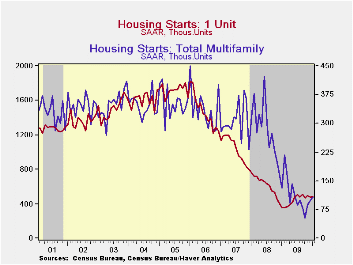
Last month, starts of single-family homes ticked up just 1.5% to 484,000 after December's 3.0% decline. Year-to-year starts have risen by one-third but they're up just 1.5% from the 4Q average. During the last ten years, there has been an 84% correlation between the q/q change in single-family starts and their contribution to quarterly GDP growth. The increase in January starts of single-family units was contained by declines in the Midwest (63.0% y/y) and in the Southern (28.5% y/y) regions of the country. In the Northeast starts rose moderately m/m (82.1% y/y) and in the West starts just recouped the moderate December decline (21.7% y/y).
A 9.2% increase in starts of multi-family units added to firmer increases during the prior two months. Starts of apartments, condominiums & town houses still were down 76.2% from the January 2006 peak.
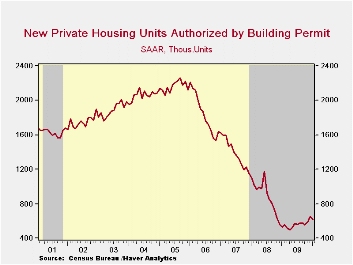
Despite a moderate 4.9% m/m decline, January building permits remain up by one-quarter from their low last March. Permits to build a single-family home rose slightly m/m and have risen one-half from their low last January.
The housing starts figures can be found in Haver's USECON database.
Mortgage Choice and the Pricing of Fixed-Rate and Adjustable-Rate Mortgages from the Federal Reserve Bank of San Francisco is available here.
| Housing Starts (000s, SAAR) | January | December | November | Nov. Y/Y | 2009 | 2008 | 2007 |
|---|---|---|---|---|---|---|---|
| Total | 591 | 575 | 579 | 21.1% | 553 | 900 | 1,342 |
| Single-Family | 484 | 477 | 492 | 35.6 | 440 | 616 | 1,036 |
| Multi-Family | 107 | 98 | 87 | -18.3 | 113 | 285 | 306 |
| Building Permits | 621 | 653 | 589 | 16.9 | 558 | 895 | 1,392 |
by Tom Moeller February 17, 2010
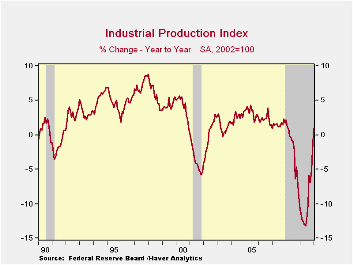 With
a 0.9%
January increase, U.S. industrial output posted its strongest monthly
gain since August. Moreover, the run-up since the June bottom has
totaled 5.3%. That compares with a 13.2% decline during the prior year
which exceeded the declines during most other postwar recessions.
With
a 0.9%
January increase, U.S. industrial output posted its strongest monthly
gain since August. Moreover, the run-up since the June bottom has
totaled 5.3%. That compares with a 13.2% decline during the prior year
which exceeded the declines during most other postwar recessions.
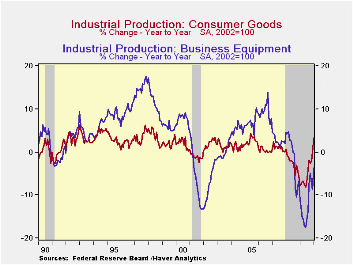
A 1.1% increase in the output of consumer goods paced the January production increase. The y/y gain of 3.2% has been driven by a nearly one-half increase in auto products output during the last year. Output of computers, video & audio output also rose 1.0% (-5.3% y/y) for the fifth consecutive strong monthly gain. Output of appliances, furniture & carpeting was unchanged last month (-7.5% y/y) after a sharp December fall which was part of an 18.1% 2009 drop. Business equipment output was strong for the second consecutive month but still was off 3.7% y/y after the 12.5% decline during all of last year. Finally, apparel output jumped 3.4% last month (0.7% y/y) and since its bottom has risen 5.9%.
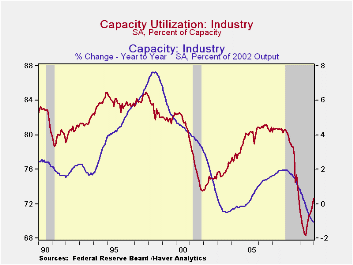
Capacity utilization rose further to 72.67%, its highest level since December 2008. In the factory sector alone utilization rose to 69.4% from the 2009 low of 65.2%. Utilization in the primary metals area has risen sharply to 61.9% from a 2009 average of 51.2% with the rebound in output. There's also been rise in utilization in the motor vehicle sector to 55.0% from a low of 36.8% in June. Utilization was 77.0% in 2005. The rise in utilization was accompanied by another 0.1% m/m decline in capacity which was off a record 1.1%y/y.
The industrial production data are available in Haver's USECON database.
Using FOMC Forecasts to Forecast the Economy from the Federal Reserve Bank of St. Louis can be found here.
| Industrial Production (SA,%) | January | December | November | Y/Y | 2009 | 2008 | 2007 |
|---|---|---|---|---|---|---|---|
| Total Output | 0.9 | 0.7 | 0.6 | 1.0 | -9.7 | -2.2 | 1.5 |
| Manufacturing | 0.9 | 0.0 | 0.9 | 1.6 | -11.3 | -3.2 | 1.4 |
| Consumer Goods | 1.1 | 0.7 | -0.3 | 3.2 | -5.2 | -2.6 | 0.9 |
| Business Equipment | 1.0 | 1.3 | -0.3 | -3.7 | -12.5 | -1.1 | 2.7 |
| Construction Supplies | 0.9 | -1.7 | 1.6 | -5.4 | -17.6 | -6.3 | -2.0 |
| Materials | 0.8 | 0.5 | 1.3 | 2.0 | -10.9 | -1.9 | 2.0 |
| Utilities | 0.7 | 6.3 | -3.0 | -0.5 | -2.6 | 0.3 | 3.4 |
| Capacity Utilization (%) | 72.6 | 71.9 | 71.3 | 71.1 (Jan. '09) | 70.1 | 77.5 | 80.6 |
by Tom Moeller February 17, 2010
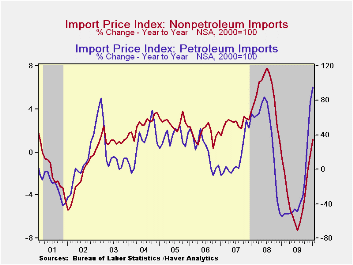
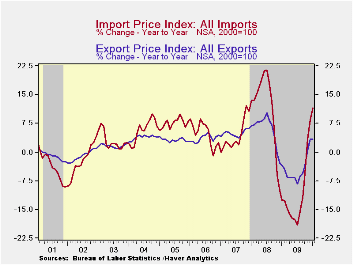 Higher
oil
prices and the lower dollar have been the primary factors behind the
movement in import prices this past year. Just for January, a 1.4% rise
in prices was nearly the strongest since last June and beat Consensus
expectations for a 1.0% gain.
Higher
oil
prices and the lower dollar have been the primary factors behind the
movement in import prices this past year. Just for January, a 1.4% rise
in prices was nearly the strongest since last June and beat Consensus
expectations for a 1.0% gain.
Petroleum prices jumped 4.8% last month and they have roughly doubled since last January. This month, the strength in Brent crude oil prices tapered off with a decline to an average $72.91 after reaching a daily high near $80 per barrel early in January.
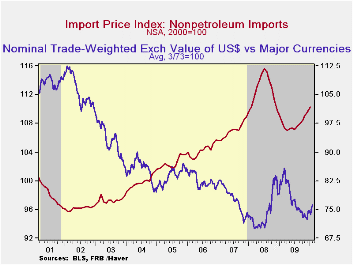
Conversely the lower value of the U.S. dollar has helped lift non-oil import prices. A 0.6% January increase was near the elevated gains during the prior four months. Since their low last March non-oil import prices have risen 2.4% after a 5.3% decline during the prior twelve months. (During the last ten years, there has been a negative 81% correlation between the nominal trade-weighted exchange value of the US dollar vs. major currencies and the y/y change in non-oil import prices.)
Prices for nonauto consumer goods rose for the first month in the last three but the slight y/y increase is improved from the deflation as of last Fall. Prices for durable consumer goods increased a firm 0.6% to lift the y/y increase to 0.6% from a 1.1% decline as of last fall. Capital goods also slipped m/m but the pace of price deflation has slowed.
Total export prices increased 0.8% (3.4% y/y) reflecting a 1.4% (4.5% y/y) increase in agricultural export prices and a 0.7% gain (3.3% y/y) in non-agricultural prices. These declines reversed just some of the strength through 2008
The import and export price series can be found in Haver's USECON database. Detailed figures are available in the USINT database.
Is the International Role of the Dollar Changing? from the Federal Reserve Bank of New York can be found here.
| Import/Export Prices (NSA, %) | January | December | November | Y/Y | 2009 | 2008 | 2007 |
|---|---|---|---|---|---|---|---|
| Import - All Commodities | 1.4 | 0.2 | 1.5 | 11.5 | -11.5 | 11.5 | 4.2 |
| Petroleum | 4.8 | -1.4 | 5.4 | 95.5 | -36.0 | 37.7 | 11.6 |
| Nonpetroleum | 0.6 | 0.5 | 0.6 | 1.2 | -4.2 | 5.3 | 2.7 |
| Export - All Commodities | 0.8 | 0.6 | 0.8 | 3.4 | -4.6 | 6.0 | 4.9 |
by Robert Brusca February 17, 2010
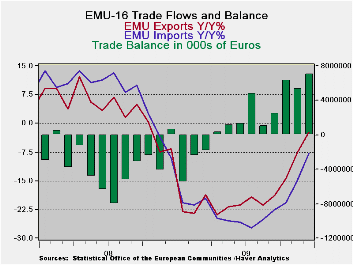
Exports rebounded strongly in December after coming up flat in November. Overall exports rose by 3.1% in December as MFG exports rose by 2.7% in December. Three month growth rates continue to show strong growth, accelerating slightly for overall exports but with MFG exports losing a bit of momentum compared to their six-month pace
Import growth is positive. Its three-and six-month rates of growth have steadied at or below the 10% growth rate mark. Manufacturing import growth is positive but barely growing at all, rising at 0.3% annualized rate of growth over three months, having slowed from nearly a 7% pace over six months.
Europe’s trade surplus is at a five year high. Exports are at their highest level in 12-months as well. Europe continues to act as a region with export-led growth. Exports are digging out from the recession faster than imports. Imports are lower by 8% Yr/yr compared to exports that are lower by just 2%.
Domestic demand is lagging in the Euro-Area. Exports are pulling the region into recovery faster than its own consumers. Europe’s recovery depends on the continuation of global growth as much as any region.
| Euro-Area Trade trends for goods | ||||||
|---|---|---|---|---|---|---|
| m/m% | % Saar | |||||
| Dec-09 | Nov-09 | 3M | 6M | 12M | 12M Ago | |
| Balance* | € 7,003 | € 5,294 | € (3,252) | € 4,482 | € (3,450) | € 1,384 |
| Exports | ||||||
| All Exp | 3.1% | 0.0% | 25.6% | 22.6% | -2.3% | -6.6% |
| Food and Drinks | 4.8% | 1.7% | 18.3% | 10.6% | -1.9% | 4.6% |
| Raw materials | 7.7% | -0.7% | 51.4% | 31.5% | 24.6% | -19.2% |
| Other | 2.9% | -0.2% | 25.6% | 23.4% | -2.9% | -7.1% |
| MFG | 2.7% | -0.3% | 17.7% | 21.3% | -5.2% | -7.2% |
| IMPORTS | ||||||
| All IMP | 1.7% | 0.9% | 7.2% | 10.7% | -7.8% | -9.1% |
| Food and Drinks | -1.3% | 3.2% | -14.0% | -3.1% | -8.7% | 1.7% |
| Raw materials | 4.4% | 3.2% | 41.2% | 43.8% | -19.0% | -6.3% |
| Other | 1.7% | 0.6% | 7.5% | 10.5% | -7.2% | -9.9% |
| MFG | 1.5% | -0.1% | 0.3% | 6.9% | -9.2% | -8.5% |
| *Eur mlns; mo or period average | ||||||

Tom Moeller
AuthorMore in Author Profile »Prior to joining Haver Analytics in 2000, Mr. Moeller worked as the Economist at Chancellor Capital Management from 1985 to 1999. There, he developed comprehensive economic forecasts and interpreted economic data for equity and fixed income portfolio managers. Also at Chancellor, Mr. Moeller worked as an equity analyst and was responsible for researching and rating companies in the economically sensitive automobile and housing industries for investment in Chancellor’s equity portfolio. Prior to joining Chancellor, Mr. Moeller was an Economist at Citibank from 1979 to 1984. He also analyzed pricing behavior in the metals industry for the Council on Wage and Price Stability in Washington, D.C. In 1999, Mr. Moeller received the award for most accurate forecast from the Forecasters' Club of New York. From 1990 to 1992 he was President of the New York Association for Business Economists. Mr. Moeller earned an M.B.A. in Finance from Fordham University, where he graduated in 1987. He holds a Bachelor of Arts in Economics from George Washington University.
More Economy in Brief


