 Global| Aug 16 2011
U.S. Housing Starts Remain Under Intense Pressure
by:Tom Moeller
|in:Economy in Brief
Summary
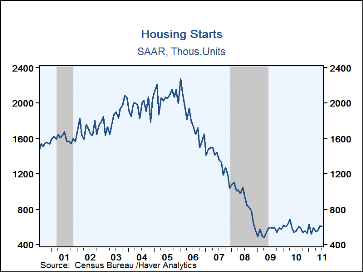
Slack demand and earlier overbuilding continue to pressure new home construction. Housing starts fell 1.5% last month to 604,000 (AR) after a downwardly revised 10.8% June gain, initially reported as 14.6%. Expectations had been for [...]
Slack demand and earlier overbuilding continue to pressure new home construction. Housing starts fell 1.5% last month to 604,000 (AR) after a downwardly revised 10.8% June gain, initially reported as 14.6%. Expectations had been for 600,000. Starts have moved sideways since the initial lift off the recession floor in 2009. As a result, the level of new building activity remains nearly three-quarters below the 2006 high.
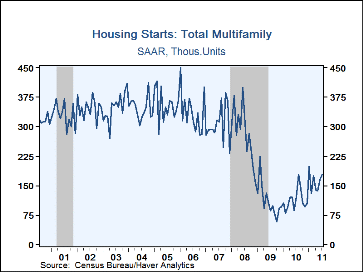
Starts of multi-family units recently have somewhat countered that trend. The 7.8% gain last month to 179,000 followed a 21.2% June increase. Multi-family starts have more-than-doubled the recession low. Starts of 2-to-4 building units generally have moved sideways. However, starts of larger buildings with 5 or more units rose for the third straight month during July and have tripled since the recession low.
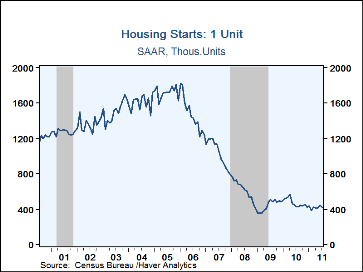
Starts of single-family units fell 4.9% last month (-0.9% y/y) and gave back most of the June gain. The lethargy of the y/y rise is evidenced by a 20% decline since last year's peak that was temporarily lifted by the first-time home-buyers tax credit. Since the 2006 peak, single-family starts have fallen by more than three-quarters
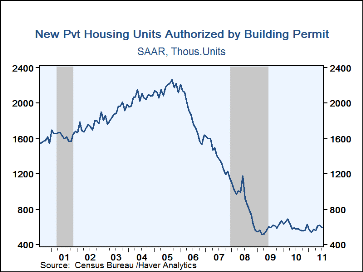
Building permits fell 3.2% (+3.8% y/y) and more-than-reversed the June uptick. Single-family permits nudged up 0.5% (-1.2% y/y) but multi-family permits fell 10.2% (16.3% y/y).
The housing starts figures can be found in Haver's USECON database. The expectations figure is contained in the AS1REPNA database.
| Housing Starts (000s, SAAR) | Jul | Jun | May | Y/Y % | 2010 | 2009 | 2008 |
|---|---|---|---|---|---|---|---|
| Total | 604 | 613 | 553 | 9.8 | 585 | 554 | 900 |
| Single-Family | 425 | 447 | 416 | -0.9 | 471 | 442 | 616 |
| Multi-Family | 179 | 166 | 137 | 47.0 | 114 | 112 | 284 |
| Starts By Region | |||||||
| Northeast | 97 | 72 | 56 | 27.6 | 72 | 61 | 120 |
| Midwest | 76 | 122 | 99 | -17.4 | 98 | 95 | 134 |
| South | 303 | 287 | 264 | 10.2 | 296 | 281 | 451 |
| West | 128 | 132 | 134 | 19.6 | 120 | 117 | 195 |
| Building Permits | 597 | 617 | 609 | 3.8 | 603 | 582 | 896 |
Tom Moeller
AuthorMore in Author Profile »Prior to joining Haver Analytics in 2000, Mr. Moeller worked as the Economist at Chancellor Capital Management from 1985 to 1999. There, he developed comprehensive economic forecasts and interpreted economic data for equity and fixed income portfolio managers. Also at Chancellor, Mr. Moeller worked as an equity analyst and was responsible for researching and rating companies in the economically sensitive automobile and housing industries for investment in Chancellor’s equity portfolio. Prior to joining Chancellor, Mr. Moeller was an Economist at Citibank from 1979 to 1984. He also analyzed pricing behavior in the metals industry for the Council on Wage and Price Stability in Washington, D.C. In 1999, Mr. Moeller received the award for most accurate forecast from the Forecasters' Club of New York. From 1990 to 1992 he was President of the New York Association for Business Economists. Mr. Moeller earned an M.B.A. in Finance from Fordham University, where he graduated in 1987. He holds a Bachelor of Arts in Economics from George Washington University.


