 Global| May 18 2010
U.S. Housing Starts Reach EighteenMonth High
by:Tom Moeller
|in:Economy in Brief
Summary
Forward momentum behind the recovery in the housing market continued to develop last month. Housing starts rose 5.8% to 672,000 (AR) units from an upwardly revised 635,000 during March. The monthly gain powered starts up by 40.9% y/y. [...]
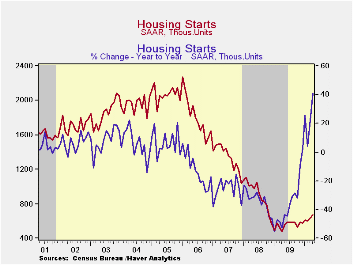
Forward momentum behind the recovery in the housing market continued to develop last month. Housing starts rose 5.8% to 672,000 (AR) units from an upwardly revised 635,000 during March. The monthly gain powered starts up by 40.9% y/y. That annual comparison is biased since its base is the lowest level reached during the recession. Nevertheless, starts were at their highest in eighteen months. The figure also beat Consensus expectations for 650,000 starts.
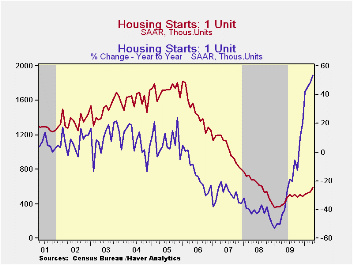
Starts of single-family homes showed the greatest improvement versus a weather-depressed March level. The 10.2% m/m gain to 593,000 (53.6% y/y) was the fourth consecutive monthly rise. Single-family starts have now risen nearly two-thirds from the recession low. In the Midwest, single-family starts jumped 17.7% (40.9% y/y) and recovered all of the sharp March decline. Nevertheless, starts still were off nearly three-quarters from the 2006 high. Starts in the South rose 14.8% (69.0% y/y) and rose 5.3% (50.0% y/y) in the Northeast where starts were roughly double the January '09 low. To the downside, starts in the West fell 4.5% (28.9% y/y).
Weakness in starts of multi-family housing units continued. An 18.6% m/m decline to 79,000 reversed all of the March gain and left them 82.4% below the 2006 high. As a result, starts of apartments, condominiums & town houses remained near their record low.
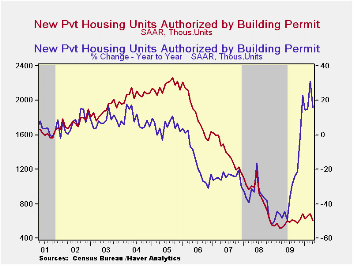
Building permits during April fell 11.5% to the lowest level since October. Permits to build a single-family home fell 10.7% (+22.5% y/y). Permits to build multi-family homes fell 14.7% but were 13.0% higher than their low last July.
The housing starts figures can be found in Haver's USECON database.
| Housing Starts (000s, SAAR) | April | March | February | April y/y | 2009 | 2008 | 2007 |
|---|---|---|---|---|---|---|---|
| Total | 672 | 635 | 612 | 40.9% | 554 | 900 | 1,342 |
| Single-Family | 593 | 538 | 527 | 53.6 | 442 | 616 | 1,036 |
| Multi-Family | 79 | 97 | 78 | -13.2 | 112 | 284 | 306 |
| Building Permits | 606 | 685 | 650 | 15.9 | 583 | 896 | 1,392 |
by Tom Moeller May 18, 2010
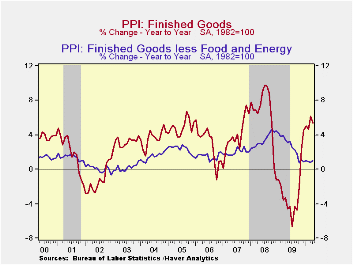
Thanks to lower food & energy prices, the overall producer price index fell 0.1% last month (+5.4% y/y) following a 0.7% March increase. Consensus expectations had been for a 0.1% uptick. Nevertheless, the y/y gain in prices of 5.4% remained near the higlyhest since late-2008.
Finished energy prices fell 0.8% (+20.6% y/y) and reversed all of the March gain. A moderate gain in not seasonally adjusted monthly gasoline prices (52.7% y/y) was the third this year and home heating oil prices rose about as they did in March (48.5% y/y). Finally, natural gas prices continued lower (-2.5% y/y) but electricity prices rose (1.6% y/y).
A 0.2% slip (+4.9% y/y) in finished food prices last month followed the 2.4% March jump. The decline was greatest amongst fresh fruit (+17.3% y/y), vegetable (33.3% y/y) and egg prices (-20.8% y/y). Beef prices (16.0% y/y) were strong for the third straight month.
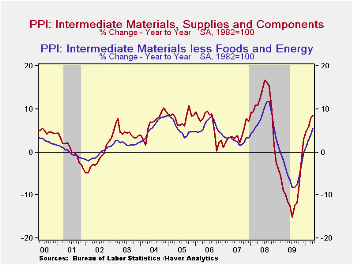
The 0.2% increase in finished producer prices less food & energy prices was the firmest since January and beat Consensus expectations for a 0.1% uptick. Nevertheless, the 1.0% y/y increase remained nearly the weakest since early-2004. Continuing to lose steam was the PPI for finished consumer goods less food & energy. It rose 0.2% and left the 1.5% y/y increase half the annual gains during the last two years. Finished durables prices ticked up 0.1% (0.4% y/y) while core finished consumer nondurable goods prices gained a modest 0.2% (2.4% y/y), nearly the weakest rise since early 2007. Capital equipment prices rose 0.2% (0.3% y/y) versus annual gains between 1.0% and 3.0% back to 2004.
Future pressure on finished goods prices may possibly stem from higher prices for intermediate goods. Their 0.8% increase raised the y/y gain to 8.5%. Core prices jumped 1.1% and the 5.6% y/y gain was the strongest since late-2008. The strength reflected increases in the price of copper & mill shapes, steel & aluminum.
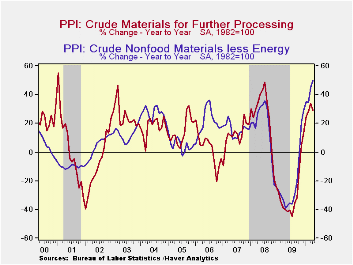
Additional price pressure to come also may be evident in the 4.0% increase (49.7 y/y) in core crude materials producer prices. The jump was led by higher scrap copper prices which have nearly doubled and iron & steel scrap prices which have more than doubled.
The producer price data is available in Haver's USECON database. More detailed data is in the PPI and in the PPIR databases.
| Producer Price Index(%) | April | March | February | y/y | 2009 | 2008 | 2007 |
|---|---|---|---|---|---|---|---|
| Finished Goods | -0.1 | 0.7 | -0.6 | 5.4 | -2.5 | 6.4 | 3.9 |
| Less Food & Energy | 0.2 | 0.1 | 0.1 | 1.0 | 2.6 | 3.4 | 2.0 |
| Intermediate Goods | 0.8 | 0.6 | 0.1 | 8.5 | -8.4 | 10.3 | 4.0 |
| Less Food & Energy | 1.1 | 0.7 | 0.9 | 5.6 | -4.2 | 7.4 | 2.8 |
| Crude Goods | -1.2 | 3.2 | -3.5 | 28.9 | -30.4 | 21.4 | 11.9 |
| Less Food & Energy | 4.0 | 6.0 | -0.6 | 49.7 | -23.5 | 14.8 | 15.6 |
by Tom Moeller May 18,2010
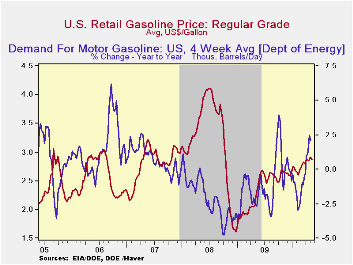
U.S. petroleum prices have come under pressure with worries about the strength of the global economic recovery. Those worries spilled through to a slightly lower pump price of regular gasoline to $2.86 last week, but that remained up more than three-quarters since December of 2008. Yesterday the spot market price for a gallon of regular gasoline was thirty cents (14%) below the high averaged during the last week of April. The figures are reported by the U.S. Department of Energy and can be found in Haver's WEEKLY & DAILY databases.
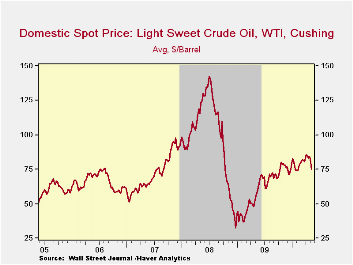
Crude oil costs continued lower as concerns rose regarding the shape of the global financial market and the worldwide economic recovery. The average price for a barrel of light sweet crude (WTI) fell last week to $74.97 versus $84.23 averaged during April. Yesterday, crude prices fell further to $70.08.
Demand for gasoline rose 2.1% last week versus one year ago and that compares with a 3.0% decline in early-February. The demand for residual fuel oil rose an easier 4.6% and distillate demand recovered 6.3% y/y. That's improved from a 12.3% decline during February. Inventories of crude oil and petroleum products improved into May but still were down moderately from one year ago.
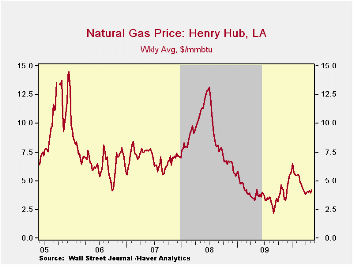
U.S. natural gas prices increased modestly last week to an average $4.20 per mmbtu (-0.7% y/y). Prices reached a high of $6.50 early in January. Nevertheless, prices remained nearly double the September low.
The energy price data can be found in Haver's WEEKLY database while the daily figures are in DAILY. The gasoline demand figures are in OILWKLY.
| Weekly Prices | 05/17/10 | 05/10/10 | 05/03/10 | y/y | 2009 | 2008 | 2007 |
|---|---|---|---|---|---|---|---|
| Retail Regular Gasoline ($ per Gallon, Regular) | 2.86 | 2.91 | 2.90 | 24.0% | 2.35 | 3.25 | 2.80 |
| Light Sweet Crude Oil, WTI ($ per bbl.) | 74.97 | 80.22 | 84.24 | 29.1% | 61.39 | 100.16 | 72.25 |
| Natural Gas Price ($/mmbtu) | 4.20 | 3.96 | 4.13 | -0.7% | 3.95 | 8.88 | 6.97 |
by Louise Curley May 18, 2010
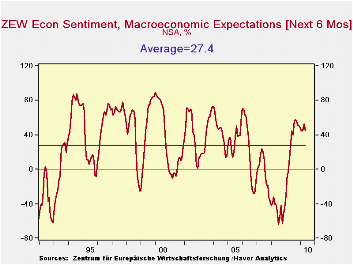
The financial crisis in the Euro Area cast a wet blanket on the optimism of German institutional investors and analysts. The survey of 275 participants was taken during the period from May 3 to May 17. The May balance of opinion of those expecting improved conditions over the next six months over those expecting worsening conditions dropped 7.2 points from 53.0% in April to 45.8% in May. The balance has fallen from the peak of 57.7% in September of last year, but it is still well above its average value of 27.4, as can be seen in the first chart.
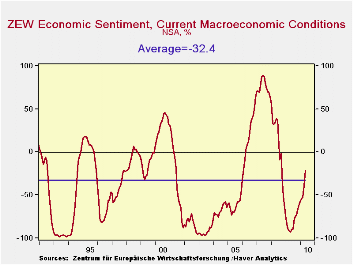
The balance of opinion on current conditions, however, improved by 17.6 points from -39.2% to 21.6% over the same period. The excess of pessimists is down substantially from the -92.8% balance in May 2009. The German financial community tends to view current conditions pessimistically. Over the life of the survey, the average view of current conditions has been a balance of pessimist over optimists of 32.4% as can be seen in the second chart. The May figure is slightly above the average.
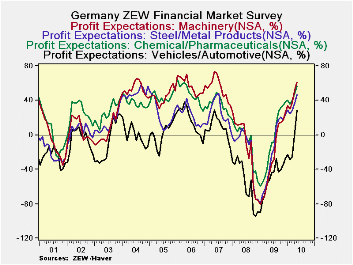
In spite of downgrade in expectations for the economy over the next six months, the financial community expects increased profits for each of the industries polled except for Services, Banking, and Insurance, industries most likely to be affected by financial turmoil. Small increases in profits are expected in the Utilities, Telecommunication, Information Technology, Construction and Consumption/Trade industries. More substantial increases in profits are expected in the Vehicle/Automotive, Chemical/Pharmaceutical, Machinery, Steel/Metal and Electronic industries. Profit expectations in the first four of these industries are shown in the third chart.
| ZEW Indicator (% Balance) | May 10 | Apr 10 | Mar 10 | Feb 10 | Jan 10 | Dec 09 | Nov 09 | Oct 09 |
|---|---|---|---|---|---|---|---|---|
| Current Conditions | -21.6 | -39.2 | -56.9 | -54.8 | -56.6 | -60.6 | -65.6 | -42.2 |
| Expectation Next Six Months | 45.8 | 53.0 | 44.5 | 45.1 | 47.2 | 50.4 | 51.1 | 56.0 |

Tom Moeller
AuthorMore in Author Profile »Prior to joining Haver Analytics in 2000, Mr. Moeller worked as the Economist at Chancellor Capital Management from 1985 to 1999. There, he developed comprehensive economic forecasts and interpreted economic data for equity and fixed income portfolio managers. Also at Chancellor, Mr. Moeller worked as an equity analyst and was responsible for researching and rating companies in the economically sensitive automobile and housing industries for investment in Chancellor’s equity portfolio. Prior to joining Chancellor, Mr. Moeller was an Economist at Citibank from 1979 to 1984. He also analyzed pricing behavior in the metals industry for the Council on Wage and Price Stability in Washington, D.C. In 1999, Mr. Moeller received the award for most accurate forecast from the Forecasters' Club of New York. From 1990 to 1992 he was President of the New York Association for Business Economists. Mr. Moeller earned an M.B.A. in Finance from Fordham University, where he graduated in 1987. He holds a Bachelor of Arts in Economics from George Washington University.
More Economy in Brief


