 Global| Sep 17 2008
U.S. Housing Starts Lowest Since 1991
by:Tom Moeller
|in:Economy in Brief
Summary
Housing starts fell hard again last month. The 6.2% m/m decline to 895,000 units (SAAR) followed a 12.4% drop during July which was revised slightly deeper. The August level was the lowest since 921,000 starts during January 1991. [...]
Housing starts fell hard again last month. The 6.2% m/m decline to 895,000 units (SAAR) followed a 12.4% drop during July which was revised slightly deeper. The August level was the lowest since 921,000 starts during January 1991. Consensus expectations had been for 950,000 starts
August starts of single-family homes fell by 1.9% to 630,000 units, also their lowest level since early-1991.
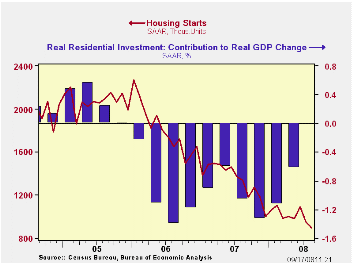
The latest figures suggest that housing this
quarter will again subtract from GDP growth. So far in 3Q,
single-family starts are down 5.8% from the 2Q average. Starts last
quarter fell by 7.2% from 1Q and that decline was accompanied by a 0.6
percentage point subtraction from real GDP growth. For 3Q the
subtraction will thus be roughly the same. During the last ten years
there has been an 84% correlation between the q/q change in
single-family starts and the contribution to quarterly GDP growth.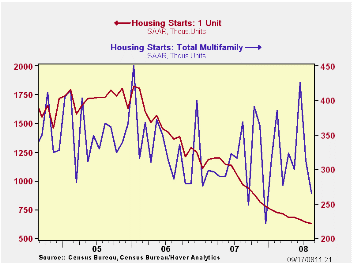
Multi-family starts have now retraced all of their rise during 2Q. They fell 15.1% last month after the 26.8% drop during July. Thus for 3Q so far, starts are down 17.6% after the 7.5% rise during 2Q.
By region, August starts of single-family units in the Northeast fell 8.6% (-14.7% y/y) following their 11.1% gain during July. The 5.3% m/m decline in the South dropped them 40.4% below the year-ago level. That was also the lowest since early 1991. In the West starts repeated their performance in July and rose 3.5% (-30.7% y/y) while single-family starts in the Midwest also rose by 5.5% (-32.7% y/y).
Building permits fell hard again. They declined 8.9% after a 17.7% plunge during July. Single-family permits repeated their July performance with a 5.1% (-40.3% y/y) decline. That was their lowest level since 1982.
The Fed's statement regarding American International Group (AIG) and the Federal Reserve Bank of New York can be found here.
| Housing Starts (000s, SAAR) | August | July | June | Y/Y | 2007 | 2006 | 2005 |
|---|---|---|---|---|---|---|---|
| Total | 895 | 954 | 1,089 | -33.1% | 1,341 | 1,812 | 2,073 |
| Single-Family | 630 | 642 | 663 | -34.9 | 1,034 | 1,474 | 1,719 |
| Multi-Family | 265 | 312 | 426 | -28.2 | 307 | 338 | 354 |
| Building Permits | 854 | 937 | 1,138 | -36.4 | 1,389 | 1,844 | 2,160 |
by Tom Moeller September 17, 2008
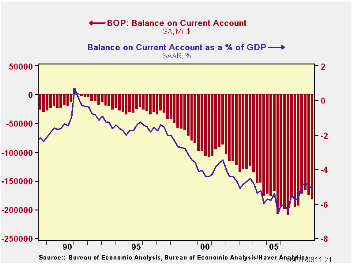
The US current account deficit deepened slightly last quarter to $183.1 billion from a revised $175.8 billion during 1Q. The 2Q deficit was slightly deeper than the Consensus expectation for a reading of $179.9 billion.
As a percentage of GDP the deficit fell to 5.1%. That level has been fairly constant during the last year. It is reduced, however, from its peak percentage late in 2005, of 6.5% of GDP.
During 2Q, the deficit on goods trade deepened again just
slightly to $216.3 billion. Higher oil prices raised imports by 4.7%
though exports continued firm and they rose by a stronger 6.1%. The
deficit grew because imports are the greater total versus exports. The
deficit on goods trade has been fairly steady near $200 billion since
late-2005.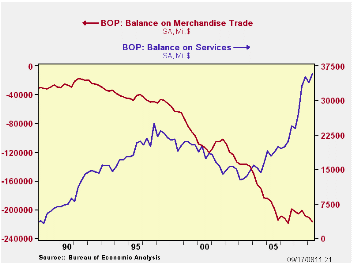
The lower U.S. dollar and the strength of foreign economies versus the U.S. continued to be apparent in the surplus in services trade. It grew to a record $35.8B but prior figures were revised to show a smaller surplus. Exports of travel services grew 22.0% y/y and passenger fares were up 31.8%, the strongest y/y gain since late-1990. Imports grew 8.9% and travel imports grew 9.1%. Passenger fares grew 16.5% y/y.
The trade surplus on earned income narrowed to $27.3B but the 1Q surplus was revised up sharply. The deficit on unilateral transfers narrowed just slightly to 29.9B.
Oil and U.S. Macroeconomy: An Update and a Simple Forecasting Exercise from the Federal Reserve Bank of St. Louis can be found here.
The Credit Crunch of 2007-2008: A Discussion of the Background, Market Reactions, and Policy Responses also from the Federal Reserve Bank of St. Louis is available here.
| US Balance of Payments, Bil.$, SA | 2Q '08 | 1Q '08 | Year Ago | 2007 | 2006 | 2005 |
|---|---|---|---|---|---|---|
| Current Account Balance ($ Bil.) | -183.1 | -175.6 | -194.1 | -731.2 | -788.1 | -729.0 |
| Deficit % of GDP | -5.1 | -5.0 | -5.8 | -5.3 | -6.0 | -5.9 |
| Balance on Goods ($ Bil.) | -216.3 | -211.0 | -205.9 | -819.4 | -838.3 | -787.1 |
| Exports | 6.1% | 4.8% | 20.7% | 12.3% | 14.4% | 10.8% |
| Imports | 4.7% | 3.3% | 14.1% | 5.7% | 10.7% | 13.9% |
| Balance on Private Services ($ Bil.) | 35.8 | 33.9 | 27.1 | 119.1 | 85.0 | 75.6 |
| Exports | 2.7% | 1.2% | 14.1% | 14.6% | 11.5% | 10.2% |
| Imports | 1.8% | 2.8% | 8.9% | 8.4% | 11.3% | 7.7% |
| Balance on Income ($ Bil.) | 27.3 | 33.2 | 9.7 | 81.8 | 57.2 | 67.2 |
| Unilateral Transfers ($ Bil.) | -29.9 | -31.7 | -25.0 | -112.7 | -92.0 | -89.8 |
by Robert Brusca September 17, 2008
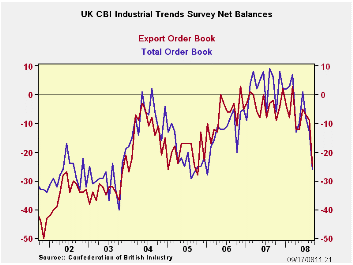
Orders overall and export orders have fallen off very sharply from August to September. The decline of 16 points in month-to-month export orders in September is a record going back to 1988. This drop occurs in the face of a weakening Sterling which implies an improvement in UK competitiveness. Total orders fell by 13 points month-to-month and that is the fourth largest m/m drop since the late 1980s. All of the outsized drops in total orders have come since October 2006.
While changes in orders on the month demonstrate a very severe drop, current readings on the diffusion levels remain higher, in the 55th percentile for total orders and the 72nd percentile for export orders. – lower but not as draconian as the monthly changes. Still both overall and total orders are deep net negative readings. The volume for output in the look ahead survey is at a new low. Prices expected in the next four months are still at all time highs: 100% of their range. The NTC survey available through August shows MFG is low in its range, in the bottom 15 percent. .
The UK economy looks extremely weak. Current levels in the CBI Industry sector are not quite as severely weak as for CBI orders but the pace of decline is something to have some real worries over and the outlook is as bad as it ever has been.
| UK Industrial Volume Data CBI Survey | |||||||||
|---|---|---|---|---|---|---|---|---|---|
| Reported: | Sep 08 |
Aug 08 |
Jul 08 |
Jun 08 |
12MO Avg | Pcntle | Max | Min | Range |
| Total Orders | -26 | -13 | -8 | 1 | -2 | 55% | 9 | -40 | 49 |
| Export Orders | -25 | -9 | -7 | -5 | -6 | 72% | 3 | -40 | 43 |
| Stocks: Fin Goods | 21 | 18 | 13 | 8 | 13 | 80% | 23 | -2 | 25 |
| Looking ahead | |||||||||
| Output Volume: Next 3 Months | 11 | -13 | -7 | 2 | 4 | 0% | 28 | -13 | 41 |
| Average Prices for Next 3 Months | 31 | 34 | 28 | 30 | 24 | 100% | 34 | -20 | 54 |
| From end 2000 | |||||||||
| Compare to CIPS MFG | |||||||||
| Aug 08 |
Jul 08 |
Jun 08 |
May 08 |
12MO Avg | Pcntle | Max | Min | Range | |
| UK MFG | 45.93 | 44.13 | 45.88 | 49.46 | 50.21 | 15% | 56.32 | 44.13 | 12 |

Tom Moeller
AuthorMore in Author Profile »Prior to joining Haver Analytics in 2000, Mr. Moeller worked as the Economist at Chancellor Capital Management from 1985 to 1999. There, he developed comprehensive economic forecasts and interpreted economic data for equity and fixed income portfolio managers. Also at Chancellor, Mr. Moeller worked as an equity analyst and was responsible for researching and rating companies in the economically sensitive automobile and housing industries for investment in Chancellor’s equity portfolio. Prior to joining Chancellor, Mr. Moeller was an Economist at Citibank from 1979 to 1984. He also analyzed pricing behavior in the metals industry for the Council on Wage and Price Stability in Washington, D.C. In 1999, Mr. Moeller received the award for most accurate forecast from the Forecasters' Club of New York. From 1990 to 1992 he was President of the New York Association for Business Economists. Mr. Moeller earned an M.B.A. in Finance from Fordham University, where he graduated in 1987. He holds a Bachelor of Arts in Economics from George Washington University.
More Economy in Brief


