 Global| Oct 20 2009
U.S. Housing Starts Inch HigherDuring September But Are Flat Over Last Four Months
by:Tom Moeller
|in:Economy in Brief
Summary
Continuing to show a loss of forward momentum was the housing sector. Housing starts ticked up slightly last month to 590,000 (AR) units versus 587,000 during August which was revised down slightly. The latest level, however, showed [...]
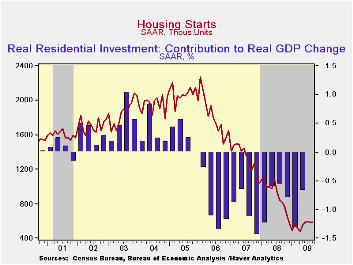
Continuing to show a loss of forward momentum was the housing sector. Housing starts ticked up slightly last month to 590,000 (AR) units versus 587,000 during August which was revised down slightly. The latest level, however, showed no growth from June. In addition, September's figure fell short of Consensus expectations for 610,000 starts.
The loss of momentum owes to weakness in the multi-family sector where starts fell 15.2% m/m during September. That decline reversed roughly all of the August increase and left multi-family starts near the postwar low. Starts of apartments, condominiums & town houses remained down by roughly two-thirds from the 2006 peak.
Starts of single-family homes have shown more life recently. Single-family starts rose 3.9% last month to 501,000 units (AR) and reversed most of an August decline. They are now 40% above the low of this past winter. During the last ten years, there has been an 84% correlation between the q/q change in single-family starts and their contribution to quarterly GDP growth.
By region, starts of single-family units last month were
mixed. Single-family starts in the Northeast rose 13.0% to nearly their
highest level since October (-8.8% y/y) while starts in the South also
rose 14.3% (-5.9% y/y) to their highest level since last September. In
the Midwest, starts posted a 5.7% (-4.6% y/y) decline after a dip
during August and starts in the West fell 14.4% (-18.8% y/y) to their
lowest level since May. 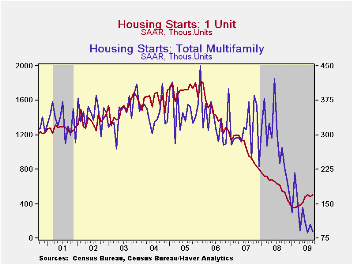
Building permits fell 1.2% and gave back much of their increase during August. Permits remained just above their record low and were down by roughly one-half from last May. As with starts, permits to build a single-family home have been relatively strong, despite a moderate 3.0% decline during September. A leading indicator of starts, permits are one-third higher than their winter low.
The housing starts figures can be found in Haver's USECON database.
| Housing Starts (000s, SAAR) | September | August | Y/Y | 2008 | 2007 | 2006 |
|---|---|---|---|---|---|---|
| Total | 590 | 587 | -28.2% | 900 | 1,342 | 1,812 |
| Single-Family | 501 | 482 | -8.7 | 616 | 1,036 | 1,474 |
| Multi-Family | 89 | 105 | -67.4 | 285 | 306 | 338 |
| Building Permits | 573 | 580 | -28.9 | 895 | 1,392 | 1,844 |
Manufacturing New Orders in France and Italy
by Louise Curley October 20, 2009
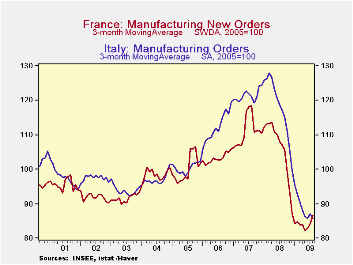
The steep declines in new orders in France and Italy that the recession exacted are beginning to show some signs of leveling out. New orders in France and Italy on a three-month moving average basis that smoothes out some of the month- to- month variation are shown in the first chart. The turnaround in France appears stronger than that in Italy. The index of French new orders in Manufacturing actually increased 3.0% in August from 87.0 (2005=100) to 89.6 but it was still 13.8% below the year ago level. At the same time, the index of Italian new orders actually declined 8.6% from 88.8 to 81.2 and was 29.8% below the year ago level.
In general, the index of new orders in Italy has been higher than that of France; and, in spite of France's better performance relative to Italy's in August, the index of Italian new orders so far this year has exceeded that of France. The average level of the index of new orders over the period January through August was 87.3 for Italy and 84.6 for France. It should be noted that comparisons of indexes between countries say nothing about actual levels in the two countries; they merely indicate that, currently, new orders in Italy compared to their level in 2005 are higher than the corresponding measures in France.
Foreign orders accounted for the big decline in the actual index of Italian orders in August. Foreign orders dropped 12.8% from 96.8 in July to 84.4 in August. In France new foreign orders actually increased 0.7% from 86.4 in July to 87.0 in August. However, on a three month average basis, which is shown in the second chart, the July increase in Italy's foreign orders has been followed by relative stability in August. In France, the upward trend started in May and has continued through August.
| Year to Date Avg | Aug 09 | Jul 09 | Aug 08 | M/M % | Y/Y& | 2008 | 2007 | 2006 | |
|---|---|---|---|---|---|---|---|---|---|
| Total New Orders | |||||||||
| Italy | 87.1 | 81.2 | 88.8 | 115.7 | -8.56 | -29.82 | 115.8 | 121.4 | 114.1 |
| France | 84.6 | 89.6 | 87.0 | 103.9 | 2.99 | -13.76 | 104.0 | 111.4 | 103.6 |
| Foreign New Orders | |||||||||
| Italy | 71.4 | 84.4 | 96.8 | 120.1 | -12.81 | -29.73 | 121.8 | 131.3 | 117.8 |
| France | 64.0 | 87.0 | 86.4 | 101.7 | -.69 | -14.45 | 104.6 | 115.8 | 106.6 |
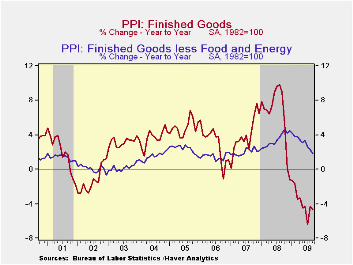
U.S. PPI Declines With Lower Energy, Food And Core Prices
by Tom Moeller October 20, 2009
 Pricing
power virtually evaporated last month with across-the-board declines in
goods prices. The PPI for finished goods fell 0.6%. It was the second
decline in the last three months and left prices down 4.7% from the
year-ago level. The decline compared to the Consensus expectation for
no change. Moreover, it was broad-based and included lower food
& energy prices as well as the third decline in core prices in
the last five months. The 0.1% decline in the PPI less food &
energy contrasted with expectations for a 0.1% increase and it pulled
the y/y change to 1.8%, the weakest since May 2007.
Pricing
power virtually evaporated last month with across-the-board declines in
goods prices. The PPI for finished goods fell 0.6%. It was the second
decline in the last three months and left prices down 4.7% from the
year-ago level. The decline compared to the Consensus expectation for
no change. Moreover, it was broad-based and included lower food
& energy prices as well as the third decline in core prices in
the last five months. The 0.1% decline in the PPI less food &
energy contrasted with expectations for a 0.1% increase and it pulled
the y/y change to 1.8%, the weakest since May 2007.
 Lower
finished energy prices led the decline in last month's PPI with a 2.4%
drop (-22.2% y/y). Though the decline has been partially reversed here
in October, last month it reflected a 5.4% fall in gasoline prices
(-37.5% y/y). Natural gas prices also fell by 1.9% (-24.5% y/y) and
fuel oil prices fell 24.1% (-40.5% y/y).
Lower
finished energy prices led the decline in last month's PPI with a 2.4%
drop (-22.2% y/y). Though the decline has been partially reversed here
in October, last month it reflected a 5.4% fall in gasoline prices
(-37.5% y/y). Natural gas prices also fell by 1.9% (-24.5% y/y) and
fuel oil prices fell 24.1% (-40.5% y/y).
The PPI for finished consumer goods less food & energy slipped 0.1% but gained 2.2% y/y. That was the weakest annual increase since June 2007. Finished durables prices slipped 0.2% (+2.0% y/y) and prices of core finished consumer nondurable goods slipped for the fourth month in the last six. The 2.3% y/y increase was down from 5.9% as of last November. Capital equipment prices also reflected economic weakness and slipped 0.1%. That pulled the y/y increase down to 1.4% after a 4.3% rise as of last December.
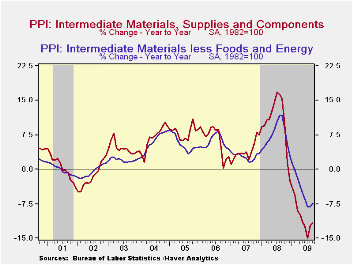
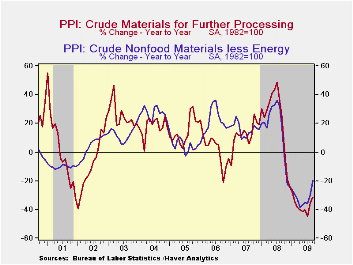 Prices for
intermediate goods inched 0.2%
higher, paced by a firm 0.9%
increase in core prices. They were led by a 1.3% (-11.3% y/y) increase
in prices for materials for manufacturing. Intermediate food prices
fell 0.5% (-12.9% y/y) and energy prices also slipped 2.1% (-24.2%
y/y).
Prices for
intermediate goods inched 0.2%
higher, paced by a firm 0.9%
increase in core prices. They were led by a 1.3% (-11.3% y/y) increase
in prices for materials for manufacturing. Intermediate food prices
fell 0.5% (-12.9% y/y) and energy prices also slipped 2.1% (-24.2%
y/y).
The crude materials PPI fell 2.1% and was led lower by a 5.4% decline (-42.6% y/y) in crude energy prices. In contrast, core prices showed strength and increased for the sixth straight month.
The producer price data is available in Haver's USECON database. More detailed data is in the PPI and in the PPIR databases.
| Producer Price Index (%) | September | August | Y/Y | 2008 | 2007 | 2006 |
|---|---|---|---|---|---|---|
| Finished Goods | -0.6 | 1.7 | -4.7 | 6.4 | 3.9 | 2.9 |
| Core | -0.1 | 0.2 | 1.8 | 3.4 | 2.0 | 1.5 |
| Intermediate Goods | 0.2 | 1.8 | -11.6 | 10.5 | 4.0 | 6.4 |
| Core | 0.9 | 0.6 | -7.5 | 7.4 | 2.8 | 6.0 |
| Crude Goods | -2.1 | 3.8 | -31.5 | 21.4 | 11.9 | 1.4 |
| Core | 3.6 | 6.0 | -19.6 | 14.8 | 15.6 | 20.8 |
Weekly Gasoline Prices Increase With Stronger Crude Oil Prices
by Tom Moeller October 20, 2009
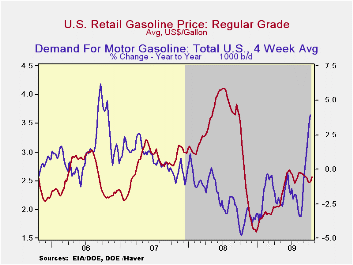
The pump price for regular gasoline increased last week to $2.57 per gallon and the gain reversed most of the decline since early last month. Moreover, prices remain up from the December low of $1.61. In addition, prices recently moved even higher and the wholesale gasoline price broached the $2.00 level for the first time since early-August. This level is nearly the highest in one year. The figures are reported by the U.S. Department of Energy and can be found in Haver's WEEKLY & DAILY databases.
The crude oil market certainly has firmed
and light sweet crude prices (WTI) rose to $75.74 per barrel last week,
up from the December low of $32.37. Yesterday, the spot market price
for light sweet crude oil rose even further to $79.61 per barrel.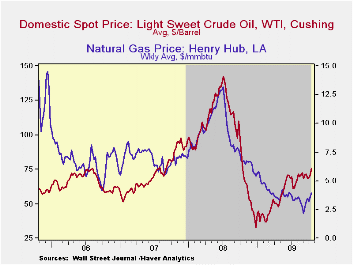
Behind the increase in energy prices is an increase in the demand for gasoline. Last week, it posted a 4.0% rise versus one year ago. The gain was the strongest since the fall of 2006. Demand for residual fuel oil also increased 12.6% y/y while distillate demand halved its recent decline to 11.3% y/y. Finally, oil remains plentiful as evidenced by a 13.0% y/y rise in inventories of crude oil & petroleum products. The gain in inventories of gasoline has eased sharply, however, to 7.9% versus last year. The figures on crude oil production and inventories are available in Haver's OILWKLY database.
Natural gas prices increased again last week, ahead of the winter heating season, to an average of $3.63 per mmbtu (-45.8% y/y) but they remained down by three-quarters from the high reached in early-July of last year of $13.19/mmbtu. Yesterday prices increased further to $4.00/mmbtu.
| Weekly Prices | 10/19/09 | 10/12/09 | Y/Y | 2008 | 2007 | 2006 |
|---|---|---|---|---|---|---|
| Retail Regular Gasoline ($ per Gallon, Regular) | 2.57 | 2.49 | -11.7% | 3.25 | 2.80 | 2.57 |
| Light Sweet Crude Oil, WTI ($ per bbl.) | 75.74 | 70.86 | 0.7% | 100.16 | 72.25 | 66.12 |

Tom Moeller
AuthorMore in Author Profile »Prior to joining Haver Analytics in 2000, Mr. Moeller worked as the Economist at Chancellor Capital Management from 1985 to 1999. There, he developed comprehensive economic forecasts and interpreted economic data for equity and fixed income portfolio managers. Also at Chancellor, Mr. Moeller worked as an equity analyst and was responsible for researching and rating companies in the economically sensitive automobile and housing industries for investment in Chancellor’s equity portfolio. Prior to joining Chancellor, Mr. Moeller was an Economist at Citibank from 1979 to 1984. He also analyzed pricing behavior in the metals industry for the Council on Wage and Price Stability in Washington, D.C. In 1999, Mr. Moeller received the award for most accurate forecast from the Forecasters' Club of New York. From 1990 to 1992 he was President of the New York Association for Business Economists. Mr. Moeller earned an M.B.A. in Finance from Fordham University, where he graduated in 1987. He holds a Bachelor of Arts in Economics from George Washington University.
More Economy in Brief


