 Global| Apr 16 2009
U.S. Housing Starts Fall to Second Lowest Level on Record But Bottom May Be Forming
by:Tom Moeller
|in:Economy in Brief
Summary
The breather in the housing market downturn proved short-lived as housing starts fell to the second lowest level on record. The Commerce Department indicated that total housing starts in March reversed nearly all of their February [...]
The breather in the housing market downturn proved short-lived as housing starts fell to the second lowest level on record. The Commerce Department indicated that total housing starts in March reversed nearly all of their February gain and fell 10.8% to 510,000. The February level was revised down slightly and the latest figure compares to Consensus expectations for 550,000 starts.
The reversal occurred as starts of multi-family homes fell 29.0% to 152,000 after a downwardly revised 62.1% February increase. The latest levels are the lowest since the early 1990s.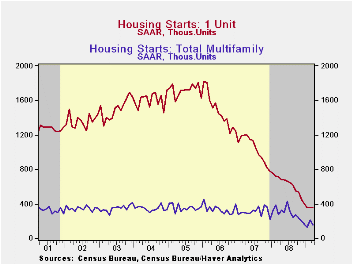
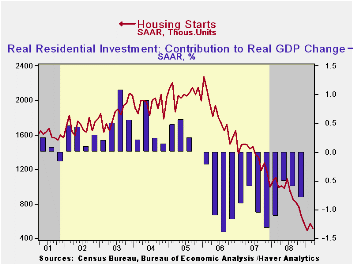
Despite these latest declines, a bottom in the housing market seems to be forming. Starts of single-family homes were unchanged last month at 358,000 after a slight uptick in February. Nevertheless, they remained near the record low for the series which dates back to 1959. The latest level is down eighty percent since the peak in early 2006. During the last ten years, there has been an 84% correlation between the q/q change in single-family starts and their contribution to quarterly GDP growth.
By region, starts of single-family units in the Northeast roughly repeated their February gain and rose 30.6% (-29.9% y/y). Starts in the Midwest ticked up a lesser 3.6% (-47.2% y/y) after their sharp 17.0% February recovery but in the South, single-family starts were quite weak. They fell to a new record low (-49.7% y/y). In the West, starts also were depressed as their 3.3% uptick (-59.6% y/y) followed a 25.6% February decline. Starts here have fallen 87.3% from their 2005 peak.
The latest figures covering permits to build single-family homes, a leading indicator of starts, also suggest that a bottom in housing activity may be forming. Though they fell 7.4% last month, that followed a 16.1% rise in February and permits roughly equal the December level.
The housing starts figures can be found in Haver's USECON database.
The Fed's latest Beige Book covering regional economic conditions can be found here.
| Housing Starts (000s, SAAR) | March | February | January | Y/Y | 2008 | 2007 | 2006 |
|---|---|---|---|---|---|---|---|
| Total | 510 | 572 | 488 | -48.4% | 903 | 1,341 | 1,812 |
| Single-Family | 358 | 358 | 356 | -49.6 | 617 | 1,034 | 1,474 |
| Multi-Family | 152 | 214 | 132 | -45.1 | 286 | 307 | 338 |
| Building Permits | 513 | 564 | 531 | -45.0 | 880 | 1,389 | 1,844 |

Tom Moeller
AuthorMore in Author Profile »Prior to joining Haver Analytics in 2000, Mr. Moeller worked as the Economist at Chancellor Capital Management from 1985 to 1999. There, he developed comprehensive economic forecasts and interpreted economic data for equity and fixed income portfolio managers. Also at Chancellor, Mr. Moeller worked as an equity analyst and was responsible for researching and rating companies in the economically sensitive automobile and housing industries for investment in Chancellor’s equity portfolio. Prior to joining Chancellor, Mr. Moeller was an Economist at Citibank from 1979 to 1984. He also analyzed pricing behavior in the metals industry for the Council on Wage and Price Stability in Washington, D.C. In 1999, Mr. Moeller received the award for most accurate forecast from the Forecasters' Club of New York. From 1990 to 1992 he was President of the New York Association for Business Economists. Mr. Moeller earned an M.B.A. in Finance from Fordham University, where he graduated in 1987. He holds a Bachelor of Arts in Economics from George Washington University.
More Economy in Brief


