 Global| Dec 18 2007
U.S. Housing Starts Down As Expected in November
by:Tom Moeller
|in:Economy in Brief
Summary
November housing starts fell 3.7% from October to 1.187M units. Starts in October were revised up slightly due to more starts of multi-family units. Last month's figure matched Consensus expectations for 1.18M starts. Single-family [...]
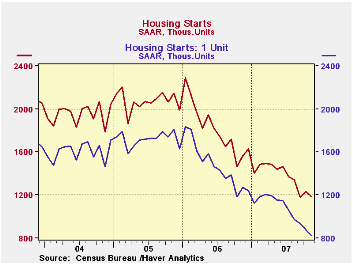
November housing starts fell 3.7% from October to 1.187M units. Starts in October were revised up slightly due to more starts of multi-family units. Last month's figure matched Consensus expectations for 1.18M starts.
Single-family starts fell last month by another 5.4% m/m to 829,000 units (AR), the lowest level since 1991 and down 55% from the peak during January 2006.
Multi-family starts were roughly unchanged after the 45.9% m/m
spike in October.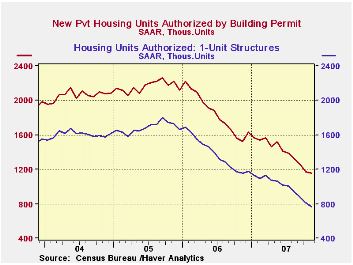
By region, single family starts in the Northeast retraced nearly all of the recovery during October with a 20.0% (-29.2% y/y) decline. Single family starts in the Midwest also were quite weak and fell 20.8% (-28.6% y/y). Single family starts in the West fell a more moderate 6.8% m/m yet remained down 63.9% from the 2005 peak. In the South starts reversed a third of the October decline with a 5.4% m/m increase (-36.1% y/y).
Building permits fell 1.5% (-24.6% y/y) and were off by nearly one half from the 2005 peak. Single-family permits fell as well by 5.6% (-33.7% y/y) and were off an even greater 57.5% from the peak.
Housing Woes Weigh Heavily on the Economy from the Federal Reserve Bank of St. Louis can be found here.
| Housing Starts (000s, AR) | November | October | Y/Y | 2006 | 2005 | 2004 |
|---|---|---|---|---|---|---|
| Total | 1,187 | 1,232 | -24.2% | 1,812 | 2,073 | 1,950 |
| Single-Family | 829 | 876 | -34.9% | 1,474 | 1,719 | 1,604 |
| Multi-Family | 358 | 356 | 22.6% | 338 | 354 | 345 |
| Building Permits | 1,152 | 1,170 | -24.6% | 1,842 | 2,159 | 2,058 |
by Tom Moeller December 18, 2007
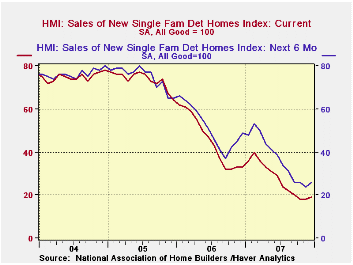
The Composite Housing Market Index from the National Association of Home Builders' (NAHB) remained unchanged m/m in December at the lowest level since early 1991. The index was 49% below the high this past February.
In December, the index fell sharply m/m in the Northeast (-48.6% y/y, was unchanged out West (-43.8% y/y) and rose in the South (-46.2 y/y and in the Midwest (-31.8% y/y).
During the last twenty years there has been a 76% correlation
between the y/y change in the Composite Index and the change in single
family housing starts.
The sub-index from the NAHB for current sales improved 5.6% in December but remained down 76% from the 2004 high.
The sub-index covering prospective sales in the next six months ticked up slightly m/m but also remained two thirds lower than the 2005 peak.
Traffic of prospective home buyers virtually dried up and fell 17.6% m/m, down three quarters 2005 high.
The NAHB index is a diffusion index based on a survey of
builders. Readings above 50 signal that more builders view conditions
good than poor.
Visit the National Association of Home Builders.
| Nat'l Association of Home Builders | December | November | Dec. '06 | 2007 | 2006 | 2005 |
|---|---|---|---|---|---|---|
| Composite Housing Market Index | 19 | 19 | 33 | 27 | 42 | 67 |
by Tom Moeller December 18, 2007

Chain store sales last week rose 1.4% last week but the increase still left sales in December 0.7% below the November average, according to the International Council of Shopping Centers (ICSC)-UBS.
During the last ten years there has been a 45% correlation between the y/y change in chain store sales and the change in nonauto retail sales less gasoline.The ICSC-UBS retail chain-store sales index is constructed using the same-store sales (stores open for one year) reported by 78 stores of seven retailers: Dayton Hudson, Federated, Kmart, May, J.C. Penney, Sears and Wal-Mart.
The leading indicator of chain store sales from ICSC-UBS rose 0.4% and added to a 0.6% gain during the prior week.
Collecting Consumer Debt in America from the Federal Reserve Bank of Philadelphia is available here.
| ICSC-UBS (SA, 1977=100) | 12/14/07 | 12/07/07 | Y/Y | 2006 | 2005 | 2004 |
|---|---|---|---|---|---|---|
| Total Weekly Chain Store Sales | 475.7 | 469.3 | 2.1% | 3.3% | 3.6% | 4.7% |
by Louise Curley December 18, 2007
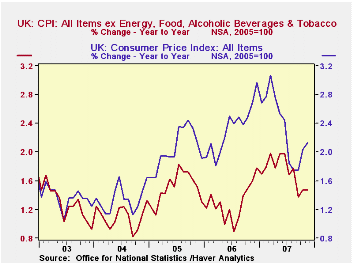
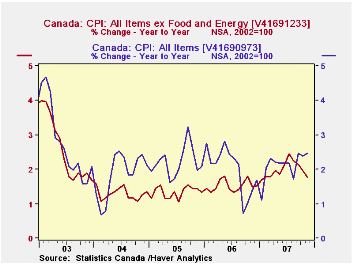
Both Canada and the United Kingdom reported lower than expected core inflation for November. In Canada, core inflation excluding food and energy was 1.76% while headline inflation was 2.47%. In the UK, comparable figures were 1.47% and 2.13%. Core and headline inflation rates for the U.K. and Canada are shown in the first and second charts. In the United States, on the other hand, the November rises in the core and headline inflation rates, announced earlier, were greater than expected. The core inflation rate was 2.33% and the headline 4.31%. Fears of stagflation--slow or no growth and inflation--are being surfacing. Former Federal Reserve Board Chairman, Greenspan, speaking on ABC's "This Week" program on December 15, said "We are beginning to get not stagflation, but the early symptoms of it."
Core inflation, usually defined as headline inflation excluding energy and food, is frequently the target of a Central Bank's monetary policy. Over time, the theory goes, rises or falls in the prices of food and energy tend to be offset by subsequent falls or rises in these prices. Exclusion of these items gives a better picture of underlying inflation. However, there are times when it may be prudent to focus not on core inflation but on the broader headline inflation. In stagflation it is the headline series that matters. The current rise in commodity prices is due less to a cyclical shortage of supply that will be corrected by a cyclical increase in production in the coming months than it is to a structural shift in world demand for food and energy, engendered, in large part, by the rapid growth of the emerging economies, especially, China. Yesterday, December 17, for example, the price of a bushel of wheat almost reached $10, its highest price on record. Soybeans also marked a record at $11.14 a bushel. Even the price of corn, which had declined earlier in the year was up to $4.10 on December 17. The daily prices of corn, wheat and soybeans over the last two years are shown in the third chart.

| INFLATION RATES | Nov 07 | Oct 07 | Nov 06 | M/M %Chg | Y/Y %Chg | 2006 | 2005 | 2004 |
|---|---|---|---|---|---|---|---|---|
| U.K. Headline (2005=100) | 105.6 | 105.3 | 103.4 | 0.28 | 2.13 | 102.3 | 100.0 | 98.0 |
| U.K. Core | 103.6 | 103.5 | 102.1 | 0.10 | 1.47 | 101.3 | 100.0 | 98.5 |
| Canada Headline (2002=100) | 111.9 | 111.6 | 109.2 | 0.27 | 2.47 | 109.1 | 107.0 | 104.7 |
| Canada Core | 109.6 | 109.6 | 107.7 | 0.00 | 1.76 | 106.9 | 105.3 | 103.9 |
| U. S. Headline (1982-84=100) | 210.2 | 208.9 | 201.5 | 0.59 | 4.31 | 201.6 | 195.3 | 188.9 |
| U. S. Core | 212.4 | 212.3 | 207.6 | 0.06 | 2.33 | 205.9 | 200.9 | 196.6 |
by Robert Brusca December 18, 2007

It may seem curious that so many Europeans are complaining
about the strength of the euro while Europe’s economic data are off
peak but are not collapsing and as the Euro Area trade surplus is still
growing in October. Growing – the SURPLUS? Why is Gernot Nerb of
Germany’s prestigious IFO saying that if the euro moves much higher,
the ECB might even consider cutting rates although Euro Area inflation
would certainly not accommodate that (nor would the growth rates of
money or credit for that matter)?
A closer look at the trade components shows what is going on.
Exports are still growing and growing faster than imports (8.6% Versus
6%, Yr/Yr for both). But one year ago export growth was 14.3% (y/y) and
one year ago import growth was 12.6% (Y/Y). So both flows have slowed
dramatically as the Euro has risen.
Over the recent three months imports are up at just less than
a 6% pace but with food and drink imports running at nearly a 25%
annual pace.
Overall exports are still growing as well, but if we look at
the all–important manufacturing category we see that manufacturing
exports have slipped from a pace of 15% one year ago to a Yr/Yr pace of
5.3% in November of 2007 and to a three month annualized pace of 4.2%
over three months. This is a marked slowdown. For imports of
manufacturing products the slippage is even more awesome. Imports of
manufacturing goods were up by 14.4% Y/Y in Nov of 2006. In Nov of 2007
that Yr/Yr growth rate is down to +1.6% and over three months that rate
is at a -10% pace.
The trade surplus continues to grow because the Zone’s imports
are falling faster than export growth, but both flows are receding
rapidly. The strong euro is impacting Euro Area exports and the
weakness in exports sending shivers through the economy and slowing
everything down impacting imports as well. It is no wonder that the
OECD is urging the ECB to be tolerant of its inflation overshoot. Even
so the policy endorsed by Nerb is an outliner.
These trade-offs are merely a sample of the sort of stuff
Europe can expect if it wishes to pursue for the Euro a role as major
reserve currency unit. Often what the FX market demands is a result
that is not copasetic with the needs the domestic economy. Welcome to
globalization.
| Euro Area 13-Trade trends for goods | ||||||
|---|---|---|---|---|---|---|
| m/m% | % Saar | |||||
| Oct-07 | Sep-07 | 3-Mo | 6-Mo | 12-Mo | 12-Mo Ago | |
| Balance* | €€ 4,017 | €€ 3,648 | €€ 3,931 | €€ 3,692 | €€ 3,251 | €€ (1,655) |
| Exports | ||||||
| All Exports | 2.3% | -1.2% | 15.3% | 13.1% | 8.6% | 14.3% |
| Food and Drinks | 0.2% | -1.8% | 3.4% | 11.0% | 7.6% | 15.0% |
| Raw materials | 1.3% | 0.6% | 1.5% | 6.3% | 6.8% | 19.7% |
| Manufacturing | -0.4% | -1.6% | 4.2% | 7.6% | 5.3% | 15.0% |
| Imports | ||||||
| All Imports | 2.0% | -0.9% | 5.9% | 11.2% | 6.0% | 12.6% |
| Food and Drinks | -3.7% | 8.8% | 24.6% | 18.1% | 11.4% | 8.7% |
| Raw materials | -0.5% | -5.0% | -16.5% | -0.4% | -4.1% | 35.7% |
| Manufacturing | -1.7% | -2.0% | -10.0% | 4.3% | 1.6% | 14.6% |
| *Eur mlns; mo or period average | ||||||

Tom Moeller
AuthorMore in Author Profile »Prior to joining Haver Analytics in 2000, Mr. Moeller worked as the Economist at Chancellor Capital Management from 1985 to 1999. There, he developed comprehensive economic forecasts and interpreted economic data for equity and fixed income portfolio managers. Also at Chancellor, Mr. Moeller worked as an equity analyst and was responsible for researching and rating companies in the economically sensitive automobile and housing industries for investment in Chancellor’s equity portfolio. Prior to joining Chancellor, Mr. Moeller was an Economist at Citibank from 1979 to 1984. He also analyzed pricing behavior in the metals industry for the Council on Wage and Price Stability in Washington, D.C. In 1999, Mr. Moeller received the award for most accurate forecast from the Forecasters' Club of New York. From 1990 to 1992 he was President of the New York Association for Business Economists. Mr. Moeller earned an M.B.A. in Finance from Fordham University, where he graduated in 1987. He holds a Bachelor of Arts in Economics from George Washington University.
More Economy in Brief


