 Global| Jun 16 2010
U.S. Housing Starts Decline, Erasing Year's Increase
by:Tom Moeller
|in:Economy in Brief
Summary
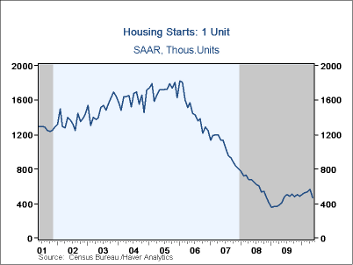
If there was any question that the government's program to stimulate housing was a success, it should be laid to rest now that it's ended. May housing starts plummeted 10% m/m to 593,000 (AR), the lowest level since December. The [...]
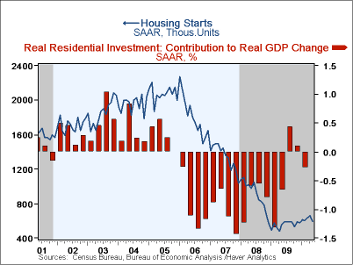 If there was any question
that the government's program to stimulate housing was a success, it
should be laid to rest now that it's ended. May housing starts
plummeted 10% m/m to 593,000 (AR), the lowest level since December. The
April level was revised down modestly. The latest figure was well short
of Consensus expectations for 648,000 starts but despite the decline,
starts remain up 21.5% from the low in January 2009.
Starts of single-family homes fell 17.2% from April to 468,000, the lowest level in twelve months. In the South, single-family starts fell by one-quarter (+10.1% y/y) while starts in the Midwest dropped 10.9% (+15.5% y/y). In the Northeast starts fell a lesser 1.7% (+54.1 y/y) and were off 2.0% (+11.1 y/y) in the West.
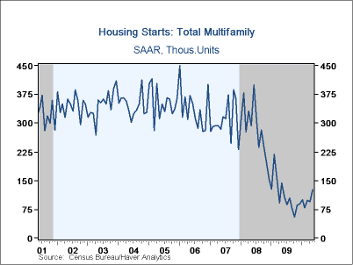
Activity in the the multi-family sector continued to improve and starts of apartments, condominiums & town houses jumped by one-third to 125,000, the highest level in twelve months.
Building permits during fell 5.9% to the lowest level in one-year. Permits to build a single-family home repeated their April decline and fell roughly 10.0% (+3.1% y/y). Permits to build multi-family homes increased 9.7% and were 26.0% higher than the low last July.
The housing starts figures can be found in Haver's USECON database.
| Housing Starts (000s, SAAR) | May | April | March | May y/y | 2009 | 2008 | 2007 |
|---|---|---|---|---|---|---|---|
| Total | 593 | 659 | 634 | 7.8% | 554 | 900 | 1,342 |
| Single-Family | 468 | 565 | 535 | 15.3 | 442 | 616 | 1,036 |
| Multi-Family | 125 | 94 | 99 | -13.2 | 112 | 284 | 306 |
| Building Permits | 574 | 610 | 685 | 4.4 | 583 | 896 | 1,392 |
by Tom Moeller June 16, 2010
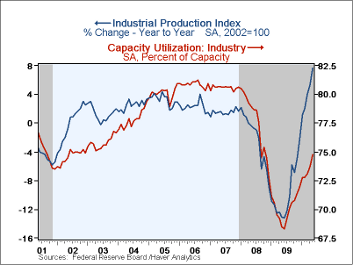 The recovery in industrial output due to improved
final demand and inventory replenishment continued last month. Overall
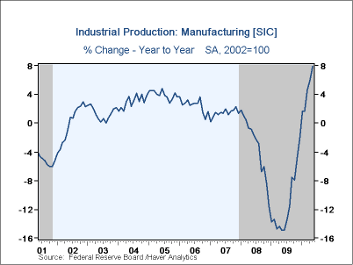
production rose 1.2% after a little revised 0.7% increase during April.
It's up at an 8.1% annual rate so far this year. These gains understate
the degree of improvement following last year's recession. In the
factory sector alone output rose 0.9% during the last two months and it
has risen at a 9.5% rate so far this year.
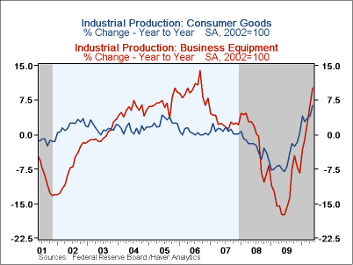
Strength in output last month was across-the-board amongst major industry groupings. In individual industries, output of motor vehicles rose 5.5% last month and by more than one-third y/y. Output of computers also posted a firm 1.4% increase (14.3% y/y) while machinery output rose 1.9% (13.3% y/y).
Output of appliances and furniture slipped after a strong April (+3.6% y/y). The level of production was one-third below the 2005 peak. Apparel output rose just 0.5% last month (7.9% y/y) and remained off by two-thirds from 1994 as production has moved out of the country.
Capacity utilization rose further to 74.7%, its highest level since November 2008. In the factory sector alone, utilization rose to 71.5%, the highest level since November 2008 and up from the 2009 low of 65.1%.
The industrial production data are available in Haver's USECON database.
| Industrial Production (SA,%) | May | April | March | May y/y | 2009 | 2008 | 2007 |
|---|---|---|---|---|---|---|---|
| Total Output | 1.2 | 0.7 | 0.3 | 7.6 | -9.7 | -2.2 | 1.5 |
| Manufacturing | 0.9 | 0.9 | 1.2 | 7.9 | -11.3 | -3.2 | 1.4 |
| Consumer Goods | 1.1 | 0.0 | 0.4 | 6.3 | -5.2 | -2.6 | 0.9 |
| Business Equipment | 1.3 | 1.7 | 1.1 | 10.1 | -12.4 | -1.1 | 2.7 |
| Construction Supplies | 0.7 | 3.0 | 2.4 | 3.9 | -17.8 | -6.3 | -2.0 |
| Materials | 1.4 | 0.8 | -0.1 | 9.2 | -10.9 | -1.9 | 2.0 |
| Utilities | 4.8 | -1.3 | -6.2 | 4.2 | -2.5 | 0.3 | 3.4 |
| Capacity Utilization (%) | 74.7 | 73.7 | 73.1 | 68.5(May '09) | 70.1 | 77.5 | 80.6 |
| Factory Utilization | 71.5 | 70.8 | 70.1 | 65.3 | 66.8 | 75.1 | 79.0 |
by Tom Moeller June 16, 2010
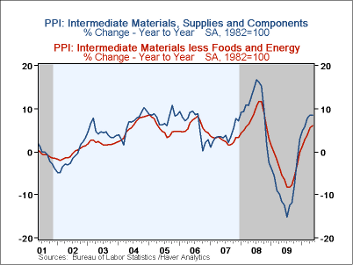
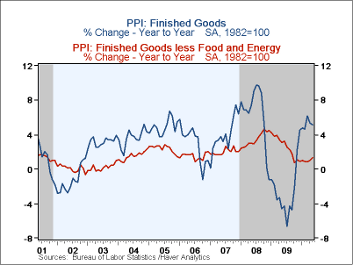 Pricing pressures continued
to ease last month. Thanks to lower food & energy prices, the
May producer price index fell 0.3% (+5.1% y/y) after a 0.1% April slip.
Consensus expectations had been for a 0.5% decline. Nevertheless, the
y/y gain in prices of 5.1% remained the highest since October 2008.
Finished energy prices fell 1.5% (+16.7% y/y) after a 0.8% April decline. Not seasonally adjusted gasoline prices slipped in May (+31.2% y/y) and home heating oil prices reversed most of their April increase (+44.8% y/y). Finally, natural gas prices fell for the third straight month (+0.7% y/y) but electricity prices rose (2.0% y/y).
Finished food prices slipped for the second consecutive month (+5.7% y/y) led by lower vegetable (+38.1% y/y) and egg prices (+3.8% y/y). These declines were countered by higher beef prices (14.5% y/y) which were strong for the fourth straight month.
The second consecutive 0.2% increase in finished producer prices less food & energy prices beat Consensus expectations for a 0.1% uptick. Still, the 1.3% y/y increase remained the weakest since October 2006. Finished consumer goods prices less food & energy rose 0.3%, still leaving the 1.9% y/y increase nearly half the annual gains during the last two years. Finished durables prices rose 0.3% (0.6% y/y) while core finished consumer nondurable goods prices rose an increased 0.4% (2.8% y/y). Capital equipment price inflation remained tame (0.6% y/y) versus annual gains between 1.0% and 3.0% back to 2004.
Intermediate goods prices continued firm with a 0.4% gain (8.4% y/y). Core prices rose a diminished 0.3% but the 6.1% y/y gain was the strongest since October 2008. The strength continued to reflect increases in the price of steel (32.4% y/y) & aluminum (16.1% y/y).
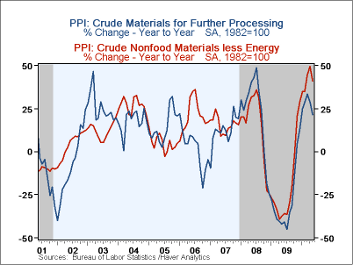
Price pressures eased last month at the earliest stage of processing. Crude materials prices fell 2.8% along with a 1.6% decline in core prices. The decline was led by lower scrap copper prices and lower iron & steel scrap prices, but they have doubled y/y.
The producer price data is available in Haver's USECON database. More detailed data is in the PPI and in the PPIR databases.
| Producer Price Index(%) | May | April | March | May y/y | 2009 | 2008 | 2007 |
|---|---|---|---|---|---|---|---|
| Finished Goods | -0.3 | -0.1 | 0.7 | 5.1 | -2.5 | 6.4 | 3.9 |
| Less Food & Energy | 0.2 | 0.2 | 0.1 | 1.3 | 2.6 | 3.4 | 2.0 |
| Intermediate Goods | 0.4 | 0.8 | 0.6 | 8.4 | -8.4 | 10.3 | 4.0 |
| Less Food & Energy | 0.3 | 1.1 | 0.7 | 6.1 | -4.2 | 7.4 | 2.8 |
| Crude Goods | -2.8 | -1.2 | 3.2 | 21.5 | -30.3 | 21.4 | 11.9 |
| Less Food & Energy | -1.6 | 4.0 | 6.0 | 41.2 | -23.5 | 14.8 | 15.6 |
by Robert Brusca June 16, 2010
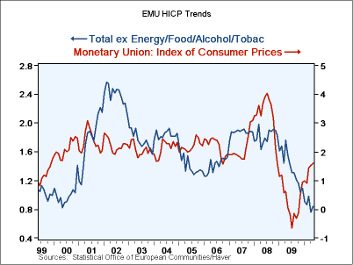 The inflation picture looks worse than the inflation reality. The chart
above shows headline inflation seemingly 'soaring' off to the races
running at a 1.6% Yr/Yr pace. Notice the scale and the push is a bit
less daunting. For 3-mo headline inflation the pace is at 2% which is
the ECB's speed limit. But in reality inflation's upsurge has all been
due to a push from oil prices that has sent goods prices soaring at 9%
annual rate over three-months. Oil has since stabilized. Service sector
inflation is hovering between 1% and 1.5%.
Moreover, core inflation in the zone is steady and low. The core rate is at 0.9% Yr/Yr and has accelerated to 1.4% over three months as energy prices have spurted. But there is no steady acceleration involved nor does the Euro-economy look like it is overheating- far from it.
The euro-area however is still growing. There is not serious sign of an economic set-back. Yet forward-looking confidence indicators have begun to crumble as UK consumer confidence fell by 10 points, and the Zew readings for Germany and Switzerland each have taken a giant step backward on the weakness in their expectations components. Still the Zew current reading for Germany continued to advance as expectations were slashed back sharply.
On balance it is not a situation that seems very hospitable to inflation. Current trends do not look that daunting; the environment is not inflation friendly. The sole inflation rating force in the Zone is the ongoing weakness in the euro itself and for that to become an issue the zone will have to get much stronger.
| Trends in HICP | |||||||
|---|---|---|---|---|---|---|---|
| % mo/mo | % saar | ||||||
| May-10 | Apr-10 | Mar-10 | 3Mo | 6Mo | 12Mo | Yr Ago | |
| EMU | 0.0% | 0.1% | 0.4% | 2.0% | 1.6% | 1.6% | 0.0% |
| Core | 0.2% | 0.0% | 0.2% | 1.4% | 0.8% | 0.9% | 1.5% |
| Goods | 0.1% | 0.8% | 1.4% | 9.9% | 3.3% | 1.9% | -1.4% |
| Services | 0.1% | 0.0% | 0.2% | 1.1% | 2.0% | 1.3% | 2.1% |
| HICP | |||||||
| Germany | 0.1% | -0.2% | 0.6% | 1.9% | 1.1% | 1.2% | 0.0% |
| France | -0.1% | 0.1% | 0.2% | 0.7% | 2.1% | 1.9% | -0.3% |
| Italy | -0.1% | 0.5% | 0.3% | 2.6% | 1.7% | 1.6% | 0.8% |
| UK | -0.2% | 0.5% | 0.4% | 2.9% | 4.0% | 3.4% | 2.2% |
| Spain | 0.1% | 0.0% | 0.3% | 1.7% | 1.0% | 1.8% | -0.9% |
| Core:xFE&A | |||||||
| Germany | 0.4% | -0.5% | 0.4% | 1.1% | 0.4% | 0.6% | 1.2% |
| France | 0.1% | -0.1% | 0.0% | -0.1% | 0.9% | 0.8% | 1.5% |
| Italy | -0.1% | 0.5% | 0.3% | 2.6% | 1.3% | 1.5% | 1.9% |
| UK | 0.1% | 0.3% | 0.4% | 2.9% | 3.1% | 2.8% | 2.1% |
| Spain | 0.2% | -0.2% | 0.1% | 0.4% | -0.4% | 0.3% | 0.9% |
by Carol Stone June 16, 2010
The FASB's new accounting rules 166 and 167 on the use of off-balance sheet accounting for securitized debt issues took effect at the beginning of 2010 for financial institutions with a calendar year fiscal year. From a data user's perspective, earlier this year, they were reflected in changes to commercial bank balance sheet data, and last week, with the release of the Q1 Flow-of-Funds data, we saw their impact more broadly on banks, GSEs and the special purpose vehicles (SPVs) these rulings were intended to reform.
It has been routine practice for issuers of securitized debt to "spin" the specific loans and the securities issues off the institutions' balance sheets to a subsidiary set up for the express purpose, an SPV. As FASB's notice explains, this SPV procedure is helpful for financing a narrowly defined project without putting an entire firm at risk. However, the original intention of the SPVs was not to distort the institution's underlying risk profile over a protracted period, which had in fact been happening, as investors found to their dismay during the recent financial crisis. These new rules basically cause the securitized debt issuers to move assets and associated securities liabilities back to their balance sheets.
The following couple of charts show the dramatic impact of the rule
changes on the biggest items. 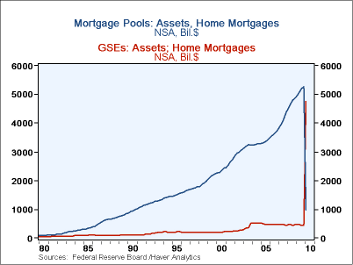 First, in the mortgage sector, 1-4 family
mortgages that are held at "agency- and GSE-backed mortgage pools"
plunged from $5.27 trillion at the end of 2009 to just $983 billion on
March 31. By contrast, the direct mortgage holdings of the agencies
themselves surged from $438 billion at year-end to $4.75 trillion on
March 31.
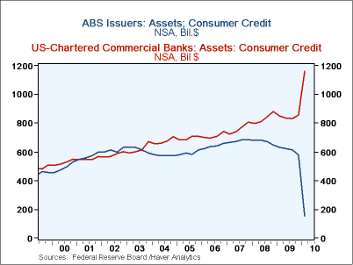
Similarly, among ABS issuers, holdings of consumer credit -- loans and credit card debt -- dropped from $578 billion on December 31 to $152 billion on March 31. The contrast here is at commercial banks, whose balance sheets now show $1,163 billion in consumer credit assets, up from $855 billion at year-end.
 Importantly,
these accounting changes did not affect the transactions generating the
"flows" of credit to either of these borrowing sectors. There were net
new issues of agency mortgage pool securities of $22 billion in Q1 and
net liquidations of $22 billion of consumer debt holdings of ABS
issuers. The Federal Reserve's data is defined as outstanding(t) =
outstanding(t-1) + flow(t) + discontinuity(t), and these accounting
changes are clearly "discontinuities".
These data series are contained in Haver's FFUNDS database. The Financial Accounting Standards Board's press release and descriptive material are found here.
Tom Moeller
AuthorMore in Author Profile »Prior to joining Haver Analytics in 2000, Mr. Moeller worked as the Economist at Chancellor Capital Management from 1985 to 1999. There, he developed comprehensive economic forecasts and interpreted economic data for equity and fixed income portfolio managers. Also at Chancellor, Mr. Moeller worked as an equity analyst and was responsible for researching and rating companies in the economically sensitive automobile and housing industries for investment in Chancellor’s equity portfolio. Prior to joining Chancellor, Mr. Moeller was an Economist at Citibank from 1979 to 1984. He also analyzed pricing behavior in the metals industry for the Council on Wage and Price Stability in Washington, D.C. In 1999, Mr. Moeller received the award for most accurate forecast from the Forecasters' Club of New York. From 1990 to 1992 he was President of the New York Association for Business Economists. Mr. Moeller earned an M.B.A. in Finance from Fordham University, where he graduated in 1987. He holds a Bachelor of Arts in Economics from George Washington University.
More Economy in Brief
 Global| Feb 05 2026
Charts of the Week: Balanced Policy, Resilient Data and AI Narratives
by:Andrew Cates


