Global| Dec 16 2014
U.S. Housing Starts & Building Permits Ease
by:Tom Moeller
|in:Economy in Brief
Summary
Housing starts during November declined 1.6% to 1.028 million (AR, +7.5% y/y) from 1.045 million in October, revised from 1.009 million. The latest figure roughly matched expectations for 1.025 million starts in the Action Economics [...]
Housing starts during November declined 1.6% to 1.028 million (AR, +7.5% y/y) from 1.045 million in October, revised from 1.009 million. The latest figure roughly matched expectations for 1.025 million starts in the Action Economics Forecast Survey.
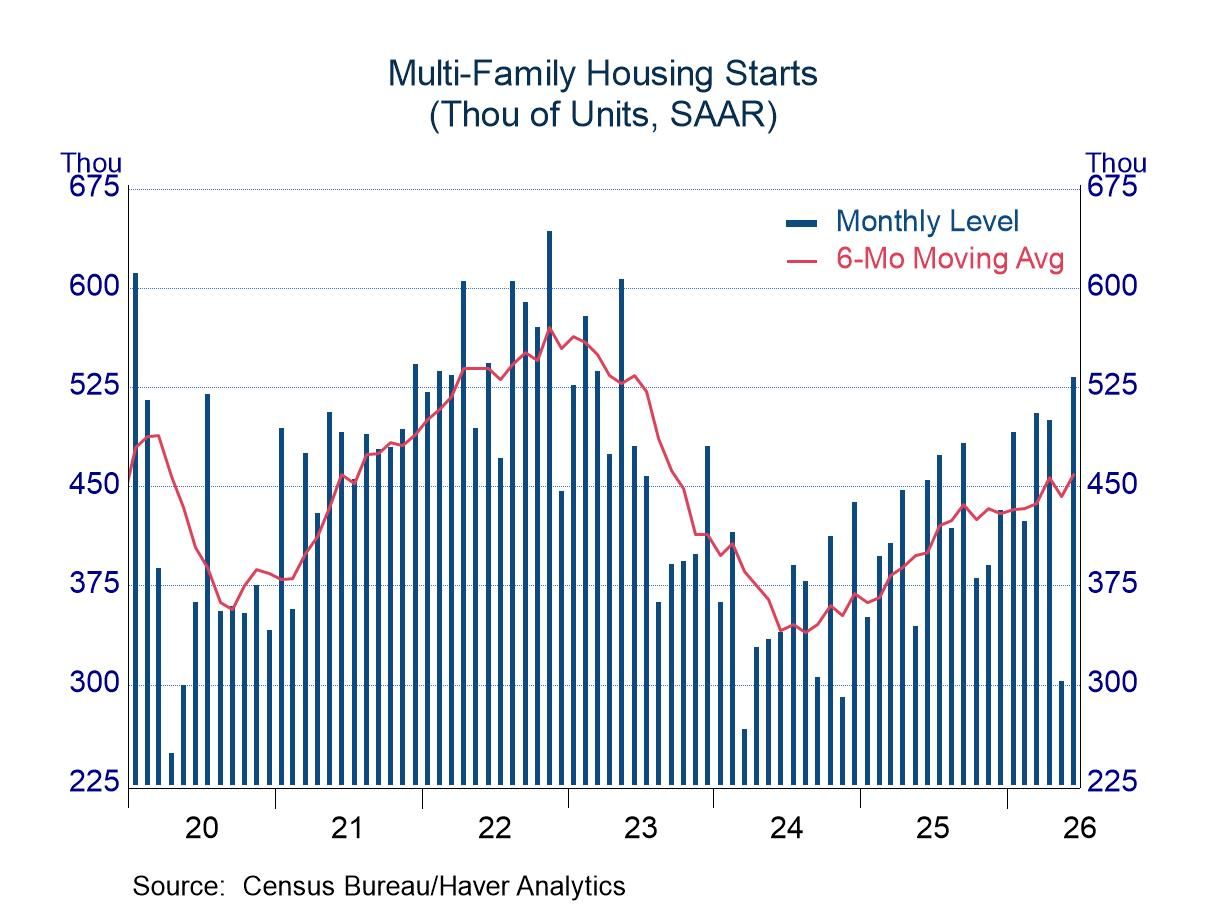
Starts in the single-family sector declined 5.4% to 677,000 units (-6.3% y/y) following October's 8.0% rise to 716,000. Starts in the multi-family sector increased 6.7% (-9.4% y/y) to 351,000 following a 9.9% decline to 329,000.
Permits to build new homes declined 5.2% to 1.035 million (-5.0% y/y) and reversed October's increase. Multi-family permits fell 11.0% to 396,000 (-3.7% y/y) while single-family permits eased 1.2% to 639,000 (-5.9% y/y).
The housing starts figures can be found in Haver's USECON database. The expectations figure is contained in the AS1REPNA database.
| Housing Starts (000s, SAAR) | Nov | Oct | Sep | Nov Y/Y % | 2013 | 2012 | 2011 |
|---|---|---|---|---|---|---|---|
| Total | 1,028 | 1,045 | 1,028 | 7.5 | 930 | 784 | 612 |
| Single-Family | 677 | 716 | 663 | -6.3 | 621 | 537 | 434 |
| Multi-Family | 351 | 329 | 365 | -9.4 | 309 | 247 | 178 |
| Starts By Region | |||||||
| Northeast | 113 | 104 | 109 | 21.6 | 96 | 80 | 68 |
| Midwest | 183 | 160 | 173 | -15.3 | 149 | 128 | 103 |
| South | 454 | 564 | 503 | -23.9 | 467 | 400 | 309 |
| West | 278 | 217 | 243 | 29.9 | 217 | 175 | 132 |
| Building Permits | 1,035 | 1,092 | 1,031 | -5.0 | 990 | 829 | 624 |
U.S. Gasoline Price Decline Accelerates, Sparking
Demand The price for a gallon of regular gasoline slumped last week to an
average $2.68 (-18.0% y/y) versus $2.78 during the prior week. The 3.6% weekly
decline was the quickest since prices hit their peak in 2011. Prices remained
down versus an interim peak of $3.65 reached this past June. Haver Analytics
constructs factors adjusting for the seasonal variation in pump prices. The
seasonally adjusted price slipped to $2.92 per gallon. WTI crude oil prices slumped to an average $67.20 last week (-30.2%
y/y) from $72.36 during the prior period. Yesterday prices were down further to
$63.05. The seasonally adjusted price generated by Haver declined to $69.36 per
barrel last week. Brent crude oil prices fell to $70.07 last week (-37.5% y/y)
and were $65.87 yesterday. Natural gas prices declined last week to $3.65 per mmbtu (-7.3% y/y)
and fell further to $3.49 yesterday. The demand for all petroleum products declined 0.6% y/y in the week
ended November 28 but gasoline demand improved 3.2% y/y as prices fell.
Inventories of crude oil and petroleum products increased 1.4% y/y but gasoline
inventories declined 1.8% y/y. The energy price data are reported by the U.S. Department of Energy and can
be found in Haver's WEEKLY database. The daily figures are in DAILY
and the petroleum demand and inventory figures are in OILWKLY.
by Tom Moeller December
16, 2014
Weekly Energy Prices
12/15/14
12/08/14
12/01/14
Y/Y%
2013
2012
2011
Retail Gasoline ($ per Gallon, Regular)
2.68
2.78
-18.0
3.51
3.62
3.52
Light Sweet Crude Oil, WTI ($ per bbl.,
WSJ)
61.11
67.20
72.36
-37.1
97.95
94.20
95.14
Natural Gas ($/mmbtu, LA, WSJ)
3.59
3.65
4.17
-6.6
3.73
2.75
3.99
U.S. Chain Store Sales Recover W/W
by Tom Moeller December 16, 2014
The International Council of Shopping Centers and Goldman Sachs reported that chain store sales improved 1.5% last week, but the gain only recovered the prior week's decline. Sales began this month roughly equal to October when purchases fell 1.3% m/m, roughly mimicking the declines during the prior two months. During the last ten years there has been a 70% correlation between the y/y change in chain store sales and the change in retail sales at general merchandise stores.
The ICSC-Goldman Sachs retail chain-store sales index is constructed using the same-store sales (stores open for one year) reported by 78 stores of seven retailers: Dayton Hudson, Federated, Kmart, May, J.C. Penney, Sears and Wal-Mart. General merchandise store sales account for 15% of total retail sales. The data can be found in Haver's SURVEYW database.
| ICSC-Goldman Sachs (SA, 1977=100) | 12/13/14 | 12/06/14 | 11/29/14 | Y/Y | 2013 | 2012 | 2011 |
|---|---|---|---|---|---|---|---|
| Total Weekly Chain Store Sales | 550.8 | 559.1 | 2.1% | 2.3% | 3.0% | 3.2% | |
| W/W % | -1.5 | -1.8 | -- | -- | -- | -- |

Tom Moeller
AuthorMore in Author Profile »Prior to joining Haver Analytics in 2000, Mr. Moeller worked as the Economist at Chancellor Capital Management from 1985 to 1999. There, he developed comprehensive economic forecasts and interpreted economic data for equity and fixed income portfolio managers. Also at Chancellor, Mr. Moeller worked as an equity analyst and was responsible for researching and rating companies in the economically sensitive automobile and housing industries for investment in Chancellor’s equity portfolio. Prior to joining Chancellor, Mr. Moeller was an Economist at Citibank from 1979 to 1984. He also analyzed pricing behavior in the metals industry for the Council on Wage and Price Stability in Washington, D.C. In 1999, Mr. Moeller received the award for most accurate forecast from the Forecasters' Club of New York. From 1990 to 1992 he was President of the New York Association for Business Economists. Mr. Moeller earned an M.B.A. in Finance from Fordham University, where he graduated in 1987. He holds a Bachelor of Arts in Economics from George Washington University.
More Economy in Brief