 Global| May 16 2008
U.S. Housing Starts April Rise Due to Multi-Family, Single-Family at 27 Year Low
by:Tom Moeller
|in:Economy in Brief
Summary
Housing starts rose unexpectedly during April to 1,032,000 units (AR), an increase of 8.2% following the March decline of 13.8% which was deeper than reported initially. The latest figure was firmer than Consensus expectations for [...]
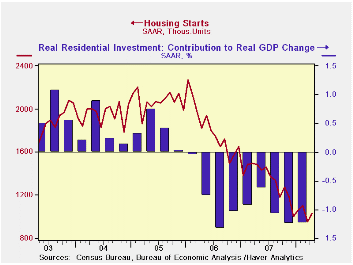
Housing starts rose unexpectedly during April to 1,032,000 units (AR), an increase of 8.2% following the March decline of 13.8% which was deeper than reported initially. The latest figure was firmer than Consensus expectations for 940,000 starts.
All of the rise in starts last month was due to a 36.0% m/m increase in starts of multi-family units. It recovered nearly all of a March decline that was deeper than reported last month.
Single family starts last month fell 1.7% to 692,000 but the
March decline of 2.5% was roughly half the drop reported initially.
Nevertheless, single family starts in April were at the lowest level
since January of 1991. They have fallen 62.0% since their January 2006
peak. Starts began this quarter 4.6% below the 1Q average.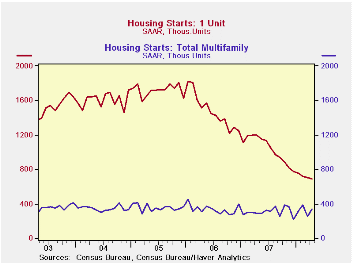
By region, declines in April starts were spread evenly across the country. In the Northeast single family starts fell 7.2% (-38.5% y/y) to a record low. In the South, single family starts fell 6.6% (-42.9% y/y) to the lowest level since 1991 but in the West single family starts reversed the March decline. Starts rose 8.3% (-43.3% y/y) although they remained down by nearly two-thirds from the August 2005 peak. In the Midwest single family starts rose 5.0% (-40.1% y/y) and they were down 71.0% from the February 2005 peak.
Building permits reversed the March decline. The total rose 4.9% paced by a 4.0% (-40.1% y/y) increase in single-family permits.
Boom and Gloom in the Housing Markets: The Sequel from the Reserve Bank of St. Louis can be found here.
The Federal Response to Home Mortgage Distress: Lessons from the Great Depression, also from the Federal Reserve Bank of St. Louis, is available here.
| Housing Starts (000s, AR) | April | March | Y/Y | 2007 | 2006 | 2005 |
|---|---|---|---|---|---|---|
| Total | 1,032 | 954 | -30.6% | 1,344 | 1,812 | 2,073 |
| Single-Family | 692 | 704 | -42.2% | 1,039 | 1,474 | 1,719 |
| Multi-Family | 340 | 250 | 17.6% | 304 | 338 | 354 |
| Building Permits | 978 | 932 | -34.3% | 1,371 | 1,842 | 2,159 |
by Tom Moeller May 16, 2008
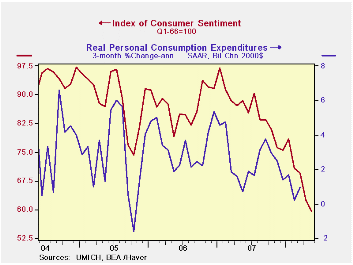
The preliminary May reading of consumer sentiment from the University of Michigan fell another 5.0% m/m to a level of 59.5. The decline was larger than Consensus expectations for a reading of 62.0. The latest level was the lowest since the brief "credit crunch" recession during 1980.
During the last ten years there has been a 47% correlation
between the level of sentiment and the three month change in real
consumer spending.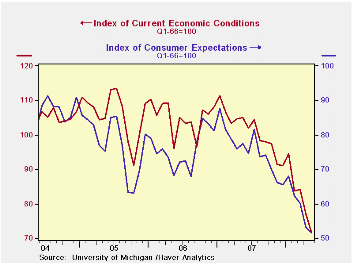
The current conditions index nearly matched its April decline and fell 6.9% to the lowest level since 1981. The view of current conditions for buying large household goods dropped hard again, this month by 6.3% (-34.4% y/y) and the view of current personal finances fell 8.1% (-30.1% y/y).Far fewer respondents indicated that their income was higher.
The expectations component of overall sentiment fell 3.0% after its 11.3% April dive. The index fell to its lowest level since late 1990. Expectations for personal finances fell slightly after a sharp April decline. Expectations for business conditions during the next year fell much more strongly by 12.5% (-63.9% y/y), about the same as during April. Expectations for conditions over the next five years just dipped m/m (-21.3% y/y).
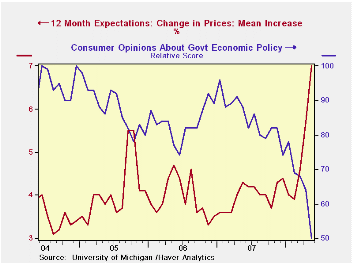
Opinions about government policy, which apparently influence economic expectations, cratered 21.9% m/m (-43.2% y/y). The percentage of those surveyed who indicated that they thought government was doing a good job was stable at 6% but those who thought a poor job was being done shot up to a record 56% from 43% in April.
The mean expected rate of inflation during the next twelve
months surged to 7.0% from 5.7% in April, the highest level since 1981.Has
the Behavior of Inflation and Long-Term Inflation Expectations Changed?
from the Federal Reserve Bank of Kansas City can be found here.
The University of Michigan survey is not seasonally adjusted.The reading is based on telephone interviews with about 500 households at month-end; the mid-month results are based on about 300 interviews. The summary indexes are in Haver's USECON database, with details in the proprietary UMSCA database.
Yesterday's speech by Fed GovernorFrederic S. Mishkin How Should We Respond to Asset Price Bubbles? can be found here.
| University of Michigan | May (Prelim.) | April | March | May y/y | 2007 | 2006 | 2005 |
|---|---|---|---|---|---|---|---|
| Consumer Sentiment | 59.5 | 62.6 | 69.5 | -32.6% | 85.6 | 87.3 | 88.5 |
| Current Conditions | 71.7 | 77.0 | 84.2 | -31.8% | 101.2 | 105.1 | 105.9 |
| Expectations | 51.7 | 53.3 | 60.1 | -33.4% | 75.6 | 75.9 | 77.4 |
by Robert Brusca May 16, 2008
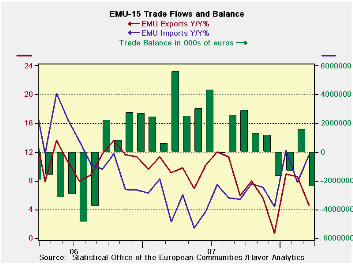
European exports fell across the board in March as imports
were steady. This plunged the trade balance back into deficit.
Sequential growth rates are still upbeat with exports accelerating over
12-mo to 6-mo to 3-mo. But imports are accelerating even faster on this
sequence. Over a broader swath of time the Yr/Yr trends show that
imports are outpacing exports and that import growth has been firmer
while export growth is fading (see chart). Indeed, there is no reason
to believe the message in the short-term sequential growth rates since
the euro keeps climbing and undermining export growth prospects. Also
growth surveys in Europe are getting progressively weaker. We did get a
surprise pop in GDP growth in 2008-Q1 – but would you want to take that
one to the bank?
Euro- Japan growth figures are less prone to adjust for the
extra leap day that we had in the first quarter. Moreover, GDP’s
‘resilience only implies that the effects of the slowdown are being
gradually phased in. Weakness in orders and in consumer confidence will
lead to weaker economic growth overall in Europe. Sometimes the lag
between what the surveys predict and what happens is longer than
expected, but the survey message is clear and so widespread it is
unlikely to be wrong.
While Germany’s DIW has hiked its growth outlook for German
growth in Q2, maybe it should be cutting it instead... Often unexpected
strong growth turns out to have borrowed growth from subsequent
quarters. One thing it does is to RAISE the level of spending to a
point that if spending goes back to trend a downside growth number will
emerge in the next quarter – that’s the arithmetic of it. In the case
of Germany and Europe I think that sort of a setback – or something
even more dramatic-- is a likely outcome in 2008-Q2.
| Euro Area 13-Trade trends for goods | ||||||
|---|---|---|---|---|---|---|
| m/m% | % Saar | |||||
| Mar-08 | Feb-08 | 3-Mo | 6-Mo | 12-Mo | 12-Mo Ago | |
| Balance* | €€ (2,382) | €€ 1,567 | €€ (714) | €€ (236) | €€ 1,144 | €€ 50 |
| Exports | ||||||
| All Exports | -2.9% | 0.6% | 18.2% | 3.2% | 4.6% | 9.1% |
| Food and Drinks | -1.4% | 0.6% | 10.9% | 4.2% | 7.4% | 9.3% |
| Raw materials | -0.4% | 1.2% | 35.4% | 10.0% | 8.4% | 11.6% |
| Other | -3.1% | 0.6% | 18.3% | 3.0% | 4.3% | 9.0% |
| MFG | -4.8% | 1.4% | 11.9% | -4.8% | -0.1% | 11.2% |
| Imports | ||||||
| All Imports | 0.0% | -1.5% | 20.3% | 12.2% | 11.6% | 2.4% |
| Food and Drinks | -3.3% | -2.0% | -11.7% | -6.3% | 7.0% | 7.5% |
| Raw materials | 0.4% | 0.6% | 10.5% | 6.2% | 5.2% | 14.4% |
| Other | 0.2% | -1.6% | 23.1% | 13.7% | 12.2% | 1.5% |
| MFG | -3.2% | -0.4% | 4.0% | -7.6% | -0.9% | 9.8% |
| *Eur mlns; mo or period average | ||||||

Tom Moeller
AuthorMore in Author Profile »Prior to joining Haver Analytics in 2000, Mr. Moeller worked as the Economist at Chancellor Capital Management from 1985 to 1999. There, he developed comprehensive economic forecasts and interpreted economic data for equity and fixed income portfolio managers. Also at Chancellor, Mr. Moeller worked as an equity analyst and was responsible for researching and rating companies in the economically sensitive automobile and housing industries for investment in Chancellor’s equity portfolio. Prior to joining Chancellor, Mr. Moeller was an Economist at Citibank from 1979 to 1984. He also analyzed pricing behavior in the metals industry for the Council on Wage and Price Stability in Washington, D.C. In 1999, Mr. Moeller received the award for most accurate forecast from the Forecasters' Club of New York. From 1990 to 1992 he was President of the New York Association for Business Economists. Mr. Moeller earned an M.B.A. in Finance from Fordham University, where he graduated in 1987. He holds a Bachelor of Arts in Economics from George Washington University.
More Economy in Brief


