 Global| Jun 28 2007
U.S. GDP Revision Ticks Growth up to +0.7%
Summary
The chart on the left overlays Yr/Yr GDP growth on Q/Q annualized GDP growth. The more volatile quarterly numbers have been slowing enough to clearly reduce the growth in Y/Y GDP to just below 2% at 1.9% in Q1 2007. However, there is [...]
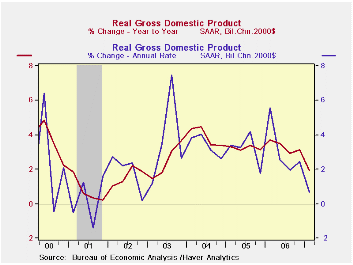
The chart on the left overlays Yr/Yr GDP growth on Q/Q annualized GDP growth. The more volatile quarterly numbers have been slowing enough to clearly reduce the growth in Y/Y GDP to just below 2% at 1.9% in Q1 2007. However, there is not much ‘GDP weakness’ left in the pipeline. In fact GDP seems to have taken much of its hit from odd places in the span of a single quarter. At 1.9% Yr/Yr GDP is weaker than each of the four annualized quarters it contains except Q1 2007. So with a better Q2 the four-quarter growth rate can easily move back up above the 2% mark. Indeed, moving up above the 0.7% mark will be a piece of cake.
Taking inventory on the downturn. The GDP slowdown is in fact made up of factors that seem unlikely to repeat. Inventory investment is the main drag on Q1 GDP at a reading of -$4.2bil and that represents a Q/Q change of -$26.6bil – it is the change in the change for inventories that feeds into GDP each quarter. So GDP suffered from its inventory malaise to the tune of minus $26.6bil not minus $4.2 bil. Inventories had grown by $22.4 bil in Q4 2006 and that was a drop off of $32bil from Q3 2006. By comparison, Q2 2006 and Q3 2006 inventory investment each were at about $55bil. So there has been an inventory correction that drastically slowed the rate of increase of inventories over the past TWO quarters and actually reduced the stock of inventories outstanding in Q1 2007.
The damage done to GDP by so few. At the same time consumer spending for goods remains strong although capital equipment spending has been limp. Inventories could continue weak but with this sort of spending on goods that is unlikely and it is more unlikely that the DROP in inventory investment (change in the change) will come anything close to the minus $26bil posted in Q1 and that means that inventories will ADD to growth in Q2 2007. Since inventories shaved 0.9% POINTS off growth in Q1 2007 that means inventories alone could add more than one percentage point to Q2 growth. Meanwhile the bulging trade gap subtracted another $23bil off from GDP or 0.8% points of growth. These two components docked GDP growth by 1.7 percentage points (saar). In other words, without these subtractions, GDP growth might have been 2.5% in Q1 2007 - hardly a disturbing number. No wonder so many economists are now changing their tune and forecasts on the economy.
Assessing the future by looking at the past. It is unrealistic to put all of those two subtractions back into GDP since while inventories cycle up and down, GDP growth makes the trade deficit bigger so we must allot some trade deterioration for each quarter due to trade unless foreign growth really picks up or US growth remains very weak. Still it is the point more than the numbers that I want to drive home.
The road ahead. To correctly assess the potential for GDP in the period ahead it is also important to gauge the Q1 2007 result Vs the trend for previous quarters. We can do that by looking at Q1 Vs the Yr/Yr by components. Except for the dollar amount comparisons – and we have talked about those above - this is what the final column in the table does (see table below).
GDP was weak in Q1 2007. Its growth rate fell short of trend by 1.2 percentage points. We can see that short fall just about (a bit less, actually) the impact of inventories and trade on the quarter. Consumer spending was strong in the quarter by a margin of 0.7 pct points (saar) over ‘trend’. Durables spending was much stronger than trend while non-durables and service sector spending were only slightly above trend. Business investment was slightly weaker relative to trend as spending on structures lagged and spending on equipment finally picked up relative to a very weak trend (it’s still not very strong). Exports were well below trend while imports were above trend. Government spending was slightly weaker than trend. The key point of this comparison is to show that GDP has not really undergone a fundamental slowing. The slowing in TOP line GDP is real and clear. But that has been the confluence of inventory and trade patterns. I view this as evidence that the economy has been working on its problems and has made a running correction, rather than as evidence of an economy running out of gas. We would expect durable goods spending by consumers to slow in Q2 but spending on non-durables and services are simply at trend. Business capital spending has begun to pick up. As the national election cycle approaches the prospect for stronger government spending is obvious. As to the international components, imports generally follow – and exceed -- trends in domestic demand; export trends have withered faster than foreign growth raising some questions on prospects there. Trade should deteriorate ahead but ‘how fast’ is still a matter of conjecture. On balance, the outlook for improved growth gotten without sticking our neck out with a wild a forecast and by looking at deviations from the past trend is actually pretty bright. Despite all the moaning about housing and sub-prime woes and higher energy prices sapping consumers, the trend in the economy shows little of that. Pessimists say the worst of it lies ahead. Optimists say worst is behind us. Pragmatists say where’s the beef? …unless they are vegetarian.
| GDP GROWTH | 2006 Q1 | 2006 Q2 | 2006 Q3 | 2006 Q4 | 2007 Q1 | 2007 Q1 | 2007 Q1 | Current | Less Prev |
| Actual/A,P,F | Actual | Actual | Actual | Actual | Advance | Prelim | Final | Yr/Yr | TREND |
| Real GDP | 5.6% | 2.6% | 2.0% | 2.5% | 1.3% | 0.6% | 0.7% | 1.9% | -1.2% |
| PCE | 4.8% | 2.6% | 2.8% | 4.2% | 3.8% | 4.4% | 4.2% | 3.5% | 0.7% |
| Durables | 19.8% | -0.1% | 6.4% | 4.4% | 7.3% | 8.8% | 8.7% | 4.8% | 3.9% |
| Nondurables | 5.9% | 1.4% | 1.5% | 5.9% | 2.9% | 3.5% | 3.2% | 3.0% | 0.2% |
| Services | 1.6% | 3.7% | 2.8% | 3.4% | 3.7% | 4.0% | 3.8% | 3.4% | 0.4% |
| Business Investment | 13.7% | 4.4% | 10.0% | -3.1% | 2.0% | 2.9% | 2.6% | 3.4% | -0.8% |
| Structures | 8.8% | 20.3% | 15.7% | 0.9% | 2.1% | 5.0% | 4.8% | 10.1% | -5.4% |
| Equipment | 15.6% | -1.4% | 7.7% | -4.8% | 1.9% | 2.0% | 1.7% | 0.7% | 1.0% |
| Housing | -0.3% | -11.1% | -18.6% | -19.8% | -17.0% | -15.4% | -15.7% | -16.4% | 0.7% |
| Inventories ($B)* | $41.2 | $53.7 | $55.4 | $22.4 | $14.8 | ($4.5) | ($4.2) | $29.9 | -- |
| Farm | $4.3 | $1.9 | $2.5 | $2.4 | $3.0 | $2.6 | $2.6 | $1.1 | -- |
| Nonfarm | $36.8 | $52.2 | $53.3 | $20.0 | $11.3 | ($7.8) | ($7.5) | ($64.0) | -- |
| Net Exports ($B)** | ($636.6) | ($624.2) | ($628.8) | ($582.6) | ($597.8) | ($611.8) | ($606.2) | $30.4 | -- |
| Exports | 14.0% | 6.2% | 6.8% | 10.6% | -1.2% | -0.6% | 0.7% | 6.0% | -5.4% |
| Imports | 9.1% | 1.4% | 5.6% | -2.6% | 2.3% | 5.7% | 5.5% | 2.4% | 3.1% |
| Government | 4.9% | 0.8% | 1.7% | 3.4% | 0.9% | 1.0% | 1.0% | 1.7% | -0.7% |
| Real Final Sales | 5.6% | 2.1% | 1.9% | 3.7% | 1.6% | 1.6% | 1.7% | 2.3% | -0.7% |
| For Yr/Yr: * average, ** Change from Yr ago Qtr | |||||||||
by Robert Brusca June 28, 2007
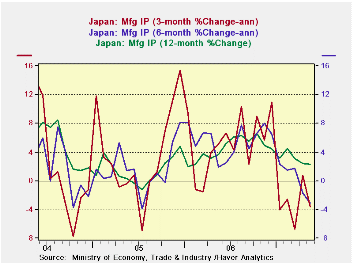
Japan’s industrial output trend is slipping as it has fallen for the third month in a row. The data show a steady deterioration in both short term and Yr/Yr trends. Still, Japanese officials are not worried. They see a snap back in the months ahead. Japanese officials are convinced of ongoing demand for Japanese made electronics. A METI survey looks for output to be up by 1.9% in June and 1.7% in July. For the time being Japan's nonmanufacturing economy is carrying growth ahead, much as it has done for the US when MFG slumped. Japan’s IP still is up by 3.7% Y/Y – but is slowing.
Despite the upbeat posture by METI, and recent comments made by the BOJ’s Fukui, the risk seems palpable and greater than the official positions admit. Fukui is worried that the output gap has been pressured too much to relieve the zero inflation situation, as his view is just one example of how Japan continues to take an optimistic view of economic events. The BoJ is ostensibly worried about causing a boom/bust cycle but doing so with no evidence of a boom at all. Growth is in fact barely moderate as the BoJ worries about the size of its output GAP and finds that the economy has been growing beyond potential for some time; Fukui says that the Japanese economy has been growing above its potential of 1.5% to 2.0% in the past few years, boosting production capacity and causing labor shortages, which has resulted in tighter supply and demand conditions. But this has gotten no traction on prices. Still Japan’s central bank is worried about overheating in the midst of a mild frost and METI is sure of rebound even as production suffers a series of setbacks.
| M/M % | SAAR % | Yr/Yr | |||||
| May-07 | Apr-07 | Mar-07 | 3-mo | 6-mo | 12-mo | Yr-Ago | |
| Mining & Manufacturing | -0.4% | -0.2% | -0.3% | -3.3% | -3.1% | 2.3% | 3.7% |
| Total Industry | -0.6% | 0.3% | -0.1% | -1.8% | -2.7% | 2.3% | 3.7% |
| Manufacturing | -0.4% | -0.2% | -0.4% | -3.7% | -3.1% | 2.3% | 3.7% |
| Food & Tobacco | 0.0% | -0.6% | 1.5% | 3.5% | 1.3% | 0.4% | -0.2% |
| Textiles | 0.3% | 0.0% | -2.1% | -6.9% | -4.7% | -4.1% | -3.5% |
| Transportation | 4.3% | -2.4% | -1.4% | 1.5% | -2.5% | 9.5% | 4.8% |
| Product | |||||||
| Consumer Goods | -3.5% | 0.6% | -2.1% | -18.3% | -8.2% | -1.5% | 2.1% |
| Intermediate Goods | -0.4% | -0.3% | 1.0% | 0.7% | -1.7% | 4.2% | 5.8% |
| Investment Goods | 1.7% | 0.6% | -2.9% | -2.3% | -1.0% | 2.2% | 0.8% |
| Mining | 0.2% | 0.4% | 0.9% | 5.8% | 3.5% | 6.2% | 2.4% |
| Electricity & Gas | -1.7% | 2.0% | 2.6% | 12.1% | 0.5% | 2.6% | 4.3% |
by Robert Brusca June 28, 2007
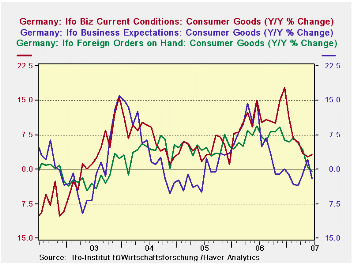
Germany's consumer goods sector is losing momentum: current situation is still improving but expectations and orders have soured.
Same picture for capital goods: current situation is still improving; expectations have gone flat while orders are getting volatile.
The IFO percentile readings show that orders on hand have slipped to the 85th percentile. Month-to-month demand has slipped to the low 70th percentile. Business expectations have fallen out of their 80th percentile. These readings are still elevated but are less than other components. The current situation is still improving. Foreign orders on hand also are still growing. But business expectations, activity (m/m) and orders on hand are shrinking.
The IFO three month outlook shows that orders expectations are faltering in wholesaling and falling in retail. Business export expectations are also fading. Only employment expectations are still improving and at a quickening pace. But employment is a notoriously lagging variable.
| Percent: Yr/Yr | Index Numbers | ||||||||
| Jun-07 | May-07 | Apr-07 | Mar-07 | Feb-07 | CURRENT | Average | Curr/Avg | Percentile | |
| Biz Climate | 0.2% | 2.8% | 2.5% | 2.1% | 3.4% | 107.0 | 95.6 | 111.9% | 92.8% |
| Current Situation | 1.7% | 4.7% | 6.3% | 6.7% | 9.3% | 111.4 | 94.7 | 117.7% | 87.9% |
| Biz Expectations | -1.3% | 1.0% | -0.9% | -2.3% | -2.1% | 102.8 | 96.6 | 106.4% | 87.4% |
| Jun-07 | May-07 | Apr-07 | Mar-07 | Feb-07 | CURRENT | Average | Curr/Avg | Percentile | |
| Biz Climate | 0.2% | 2.8% | 2.5% | 2.1% | 3.4% | 107.0 | 95.6 | 111.9% | 92.8% |
| Current Situation | 1.7% | 4.7% | 6.3% | 6.7% | 9.3% | 111.4 | 94.7 | 117.7% | 87.9% |
| MFG | 4.3% | 6.6% | 7.6% | 9.4% | 12.1% | 112.0 | 92.1 | 121.6% | 97.0% |
| Biz Expectations | Jun-07 | May-07 | Apr-07 | Mar-07 | Feb-07 | CURRENT | Average | Curr/Avg | Percentile |
| MFG | -2.8% | 1.0% | -1.4% | -3.0% | -4.1% | 100.6 | 96.4 | 104.4% | 78.1% |
| Activity (m/m) | Jun-07 | May-07 | Apr-07 | Mar-07 | Feb-07 | CURRENT | Average | Curr/Avg | Percentile |
| MFG | -3.7% | 2.0% | -0.5% | 0.4% | 4.4% | 103.8 | 96.8 | 107.2% | 81.6% |
| Demand (m/m) | Jun-07 | May-07 | Apr-07 | Mar-07 | Feb-07 | CURRENT | Average | Curr/Avg | Percentile |
| MFG | -7.1% | 0.5% | -3.6% | -1.6% | 1.6% | 102.6 | 97.0 | 105.8% | 73.3% |
| Orders on hand | Jun-07 | May-07 | Apr-07 | Mar-07 | Feb-07 | CURRENT | Average | Curr/Avg | Percentile |
| MFG | -3.6% | -0.9% | -3.0% | -2.7% | -0.6% | 105.9 | 96.3 | 110.0% | 85.8% |
| Foreign orders on hand | Jun-07 | May-07 | Apr-07 | Mar-07 | Feb-07 | CURRENT | Average | Curr/Avg | Percentile |
| MFG | 2.0% | 2.5% | 1.9% | 5.4% | 7.6% | 112.1 | 94.1 | 119.2% | 98.1% |
| Yr/Yr percentage changes in underlying Indices | |||||||||
| IFO outlook for 3-Months ahead | |||||||||
| 3-Mos ahead | Percent Year over Year | Index Numbers | |||||||
| Expected Activity | Jun-07 | May-07 | Apr-07 | Mar-07 | Feb-07 | CURRENT | Average | Curr/Avg | Percentile |
| MFG | 3.4% | 0.5% | 0.7% | -1.6% | -2.2% | 103.4 | 96.7 | 107.0% | 96.0% |
| Orders Expectations | |||||||||
| Retail Orders Expectations | -1.1% | -4.6% | -10.9% | -10.0% | -11.4% | -10.8 | -17.4 | 62.2% | 64.3% |
| Wholesale | 0.6% | 15.8% | 15.0% | 10.7% | 10.9% | 5.8 | -14.1 | -41.3% | 80.4% |
| Export Biz Expectations | |||||||||
| MFG | 0.4% | -0.5% | -1.1% | -1.9% | -1.3% | 104.5 | 98.3 | 106.3% | 94.7% |
| Employment Expectations | |||||||||
| MFG | 8.4% | 7.5% | 6.4% | 8.3% | 7.3% | 105.5 | 95.8 | 110.1% | 81.0% |
by Carol Stone June 28, 2007
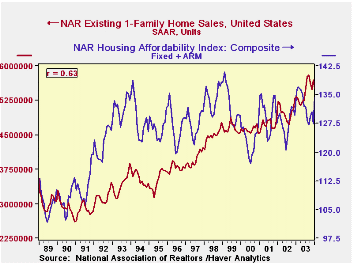
The quip in our title isn't universally applicable, but it does describe some housing market behavior in the last few years. On Monday, our colleague Bob Brusca brought us up to date on existing home sales; he interpreted these data from the National Association of Realtors (NAR) as showing "diminishing" weakness through May. Today, NAR published some details on its housing affordability indexes, and it is evident that an improvement in the affordability situation is giving some support to sales volumes.
However, we also see that the relationship between sales and affordability has largely broken down since early 2004. Buyers, sellers and financiers appeared to be in some denial as financing costs were rising from that time to the middle of last year. We can see this in the nation as a whole and in a couple of regions in particular.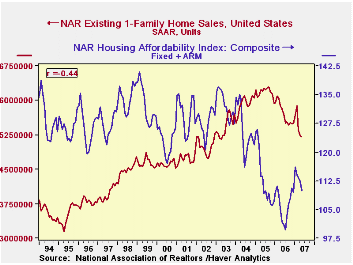
"Housing affordability" is calculated from home prices, mortgage rates and incomes. NAR analysts calculate the mortgage payment on a home at the median price financed by an average mortgage rate with a 20% down payment. Assuming the mortgage payment is 25% of household income, they can derive the "qualifying income" associated with the prevailing market conditions. The affordability index is the ratio of actual median income to the calculated qualifying income. Ordinarily, one would expect affordability and sales volume to be positively correlated: more affordability should support more sales and less affordability should be associated with fewer sales. In the first graph this is plainly the case, with a 63% correlation ratio from 1989 through 2003. But in the second graph, the 14-plus-year span from 1993 through the latest month carries a -44% ratio. People kept buying -- and lenders kept lending -- long after affordability had begun to fall sharply.
This is especially the case in the West. See in the third graph that "affordability" over the more recent time span has a whopping 75% negative relationship with sales. Affordability was already much lower there than in other areas, as seen in the table below. It shows that homes are most affordable in the Midwest and least in the West. Affordability is just about in equilibrium (that is, near 100) in the Northeast, which we find a bit surprising. This says incomes and home prices are fairly well balanced in this region, while the West faces substantially over-priced housing relative to incomes. The median household devotes a major fraction of its income to housing expense.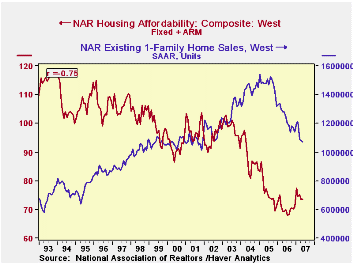
What did happen in 2004 to break up the relation of sales to so-called affordability? We show this in the fourth graph: home prices were continuing to climb, but prior to 2004, interest rates were declining enough so that the monthly payment was fairly steady as a percentage of income, hovering around 20%. All it took for affordability to start to suffer was for interest rates to stop falling. Even before they began to rise in earnest in mid-2005, affordability was dropping. It continued to decline until prices leveled out in mid-2006 and only began to recover when both mortgage rates and home prices were easing. [In the graph, we have indexed the price series to 2000=100, so it will fit nicely on the graph with an affordability index and an interest rate. Indexing is a simple-to-apply function in the DLXVG3 software.]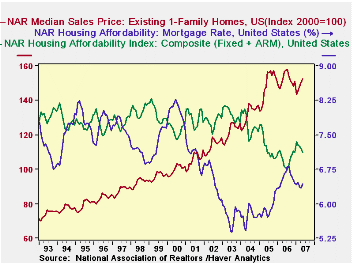
All these data are in Haver's REALTOR database, information we get from the National Association of Realtors, which also contains other detail and a national calculation of affordability for first-time homebuyers. A few summary series are contained in USECON.
| Housing Affordability Indexes | May 2007 | Apr 2007 | Mar 2007 | May 2006 | 2006 | 2005 | 2004 |
|---|---|---|---|---|---|---|---|
| Total US | 109.9 | 112.4 | 113.3 | 101.8 | 106.1 | 111.8 | 123.9 |
| Northeast | 96.7 | 94.1 | 99.7 | 91.8 | 95.5 | 99.1 | 108.7 |
| Midwest | 149.1 | 156.0 | 157.3 | 140.1 | 145.5 | 150.2 | 167.5 |
| South | 120.6 | 124.7 | 124.0 | 109.9 | 115.7 | 121.9 | 129.9 |
| West | 73.6 | 73.6 | 75.1 | 69.3 | 70.4 | 76.0 | 88.3 |

Robert Brusca
AuthorMore in Author Profile »Robert A. Brusca is Chief Economist of Fact and Opinion Economics, a consulting firm he founded in Manhattan. He has been an economist on Wall Street for over 25 years. He has visited central banking and large institutional clients in over 30 countries in his career as an economist. Mr. Brusca was a Divisional Research Chief at the Federal Reserve Bank of NY (Chief of the International Financial markets Division), a Fed Watcher at Irving Trust and Chief Economist at Nikko Securities International. He is widely quoted and appears in various media. Mr. Brusca holds an MA and Ph.D. in economics from Michigan State University and a BA in Economics from the University of Michigan. His research pursues his strong interests in non aligned policy economics as well as international economics. FAO Economics’ research targets investors to assist them in making better investment decisions in stocks, bonds and in a variety of international assets. The company does not manage money and has no conflicts in giving economic advice.
More Economy in Brief


