 Global| Apr 30 2010
U.S. GDP Growth Moderates As LiftFrom Inventories Fades
by:Tom Moeller
|in:Economy in Brief
Summary
A slower rate of inventory replenishment was warranted because products weren't leaving the shelves quickly. As a result, real GDP growth eased last quarter to 3.2% after the 5.6% jump during 4Q '09. The latest roughly matched [...]
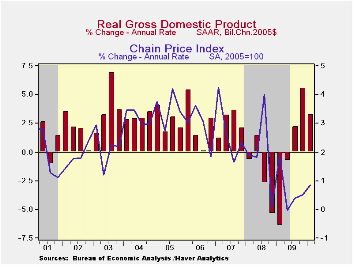
A slower rate of inventory replenishment was warranted because products weren't leaving the shelves quickly. As a result, real GDP growth eased last quarter to 3.2% after the 5.6% jump during 4Q '09. The latest roughly matched Consensus expectations for 3.4% growth. Regardless, it was the third consecutive quarter of positive growth after the recession when GDP fell 3.7% peak-to-trough, a postwar record.
The addition to growth from inventories fell to 1.6 percentage points which was roughly half the 4Q add. Inventories also helped the economy initially emerge from recession with a moderate 0.7 contribution to 3Q '09 GDP growth. Prior to these additions, inventory liquidation had subtracted from GDP growth since 2005, a length of time unprecedented in postwar history.
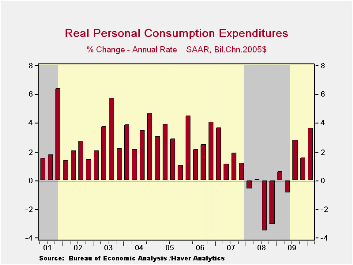
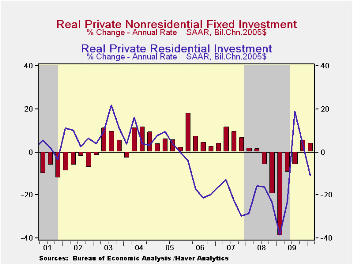
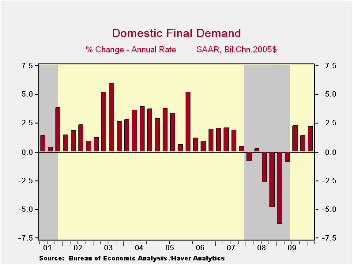
Growth in domestic final demand picked up last quarter to a still-modest 2.2% after 1.4% 4Q growth. These rates compare to up to 9.0% in the early stages of earlier economic recoveries. Last quarter's improvement was due to consumer spending growth of 3.6% after 1.6% 4Q growth. Motor vehicle purchases fell for the second straight quarter (+1.4% y/y) but spending on other consumer durables and clothing (2.1% y/y) jumped. Spending on services also improved (1.1% y/y). Fixed business investment growth remained moderate at 4.0% compared to double-digit growth early in past recoveries. Equipment spending surged 13.4% (6.9% y/y) offset by a 14.0% decline (-17.0% y/y) in structures. With an on again-off again pattern, residential investment fell 10.9% after just two quarters of positive growth. Finally, government spending fell at a 1.8% rate as budget cutbacks caused state & local spending to fall (-0.7% y/y) for the fifth time in the last six quarters.
Deterioration in the foreign trade deficit subtracted 0.6 percentage points from last quarter's gain in GDP. It was the second negative effect in the last three quarters. Growth in exports of 5.8% (10.1% y/y) was much lower than during prior two quarters. In addition import growth of 8.9% (6.9% y/y) was reduced from double-digit rates in 3Q & 4Q '09.
Price inflation remained low at 0.9% as measured by the chained GDP price index. The y/y gain of just 0.4% was the lowest since the early-1950s. The personal consumption chain price index rose a reduced 1.5% but year-to-year prices increased an improved 2.0%, the quickest since 2008. The price index for fixed business investment fell 1.7% (-3.0% y/y), the fifth consecutive quarterly decline, but the residential investment price index rose for the second consecutive quarter (-1.0% y/y).
| Chained 2005$, % AR | 1Q '10 | 4Q '09 | 3Q '09 | 1Q Y/Y | 2009 | 2008 | 2007 |
|---|---|---|---|---|---|---|---|
| GDP | 3.2 | 5.6 | 2.2 | 2.5 | -2.4 | 0.4 | 2.1 |
| Inventory Effect | 1.6 | 3.8 | 0.7 | 1.1 | -0.7 | -0.4 | -0.4 |
| Final Sales | 1.6 | 1.7 | 1.5 | 1.4 | -1.7 | 0.8 | 2.5 |
| Foreign Trade Effect | -0.6 | 0.3 | -0.8 | 0.2 | 1.0 | -1.2 | 0.8 |
| Domestic Final Demand | 2.2 | 1.4 | 2.3 | 1.2 | -2.7 | -0.4 | 1.7 |
| Personal Consumption | 3.6 | 1.6 | 2.8 | 1.8 | -0.6 | -0.2 | 2.7 |
| Business Fixed Investment | 4.0 | 5.3 | -5.9 | -1.7 | -17.8 | 1.6 | 6.2 |
| Residential Investment | -10.9 | 3.7 | 18.9 | 4.2 | -20.5 | -22.9 | -18.5 |
| Government Spending | -1.8 | -1.3 | 2.7 | 2.5 | 1.8 | 3.1 | 1.7 |
| Chained GDP Price Index | 0.9 | 0.5 | 0.4 | 0.4 | 1.2 | 2.1 | 2.9 |
by Robert Brusca April 30, 2010
European unemployment continues to rise in March and the figure reported for 2010 in-Q1 in Spain reached 20%; We report monthly data in the table above. Only Germany shows any hint of a turn to lower rates of unemployment. Of course we know that the unemployment rate lags the cycle, but we are now pretty well into this cycle and the ongoing unemployment difficulties are beyond what has been cyclical normalcy.
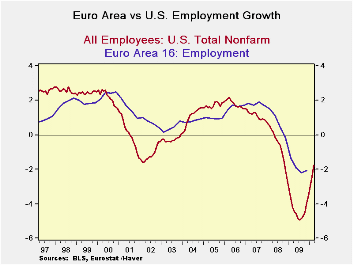
The chart at the top juxtaposes the EMU trend to the US trend for employment. Two things stand out. One is that the US series is more volatile than the European series with generally higher highs and lower lows. The other is that the low in this recent recession was much worse in the US than it was for Europe where the social safety net is much cushier. Still the turn after the fall has been much sharper in the US where Yr/Yr job losses are now occurring at a slower pace than they are in Europe.
One price that Europe pays for more government intervention in its economy is less economic vitality. The US economy is mending faster from what was admittedly a harder fall. But the US appears to be on the road to repair as jobs and GDP are showing sharper turnarounds even if they are still struggling
In Europe unemployment is very slow to repair and unemployment rates are generally still rising. Spain’s 20% rate of unemployment in 2010 Q1 is a huge burden to that economy. Also it socks a wicked punch to the rate for all of EMU that will give even the inflation-angst-ridden ECB pause on how it views inflation risks.
One of the biggest problems for the ECB is making policy in a one currency zone that has multiple fiscal policies. The regional unemployment rates in Europe have a different meaning than the regional and state-level reports in the United States where the country, currency and fiscal situation all are under one umbrella (except for state and local budgets, of course).
The recent problems in Greece and credit down grades meted out to Spain and to Portugal simply underline the sort minefield though which the ECB must pick its way. Even the tough-minded Germans did a sharp about face yesterday when the situation in Greece turned sharply for the worse. True, Germany’s stance is complicated by its being in the middle of elections. But such is the risk in such a community. With such a disparate flock of counties; there are always going to be elections somewhere in Europe. The game of musical chairs played in economics and by financial markets does not agree to let the music keep going just because one key country has an election. Contrarily, chances are that such an event brings more attention to bear on a tough call that is in the middle of deciding.
Having separate fiscal policies has just revealed what its risks are. Germans are hot that Greeks ‘lied’ bout their fiscal position and did it for the second time. But I really don’t see any reason for surprise. These countries want to have separate fiscal polices and separate political relations. Still they do want to become a single economic zone but not a country called ‘Europe.’ Their tendency to call themselves European breaks down into a laughable faced of falsity when things go wrong. Then they return to being German, or Dutch, or Greek, or whatever.
As to their relations, nations have always lied to one another. It is known as diplomacy. Diplomats are among the best trained in their respective countries and they are taught to meet you face to face and to mis-represent their country’s views from time to time for their own advantage speaking to you in your language and doing it with eloquence. I don’t see why Germans are so upset that Greeks fudged their fiscal position because to the Greeks it may have seemed ‘fair game.’ Clearly the Mass-Trick laws do not punish a county enough for cheating yet its restrictions are burdensome enough to make nations want to avoid them and cheat. Are the Mass-trick restrictions too severe to be obeyed?
Europe must take a good hard look at itself and decide what relations it wants to reserve for its member countries and which it wants to assign to an amalgamated European zone ( it already has done this is the treaty that was ‘approved across member countries. But it may need to do some fine tuning on what the ‘state’s’ rights and responsibilities really are). We need to know in what sense EMU is Europe and what sense is it not. And Europeans need to figure out when they draw that line exactly what it means.
If they are going to continue to have the usual diplomatic relations, and if they do not want those standards to percolate to their economic relations, then they are in need of requiring an independent AUDIT for each country just as there is such a requirement for a bank. Because either you can believe the numbers or you can’t. Europe needs to adopt one common set of budget accounting rules and to stick to them, to monitor them (audit compliance to them) and to enforce them. Then it may have a chance to succeed under its separate country/budget model should it choose to stick with it.
Even if it does this it will find its economic results will remain disparate because Europe is not uniform.
| Unemployment rate and changes | ||||||
|---|---|---|---|---|---|---|
| Rate | Level | Simple Changes | ||||
| Feb-10 | Jan-10 | Dec-09 | 3-Mo | 6-Mo | 12-Mo | |
| EU-Urate | 9.6 | 9.5 | 9.4 | 0.2 | 0.4 | 1.3 |
| EMU-Urate | 10.0 | 9.9 | 9.9 | 0.1 | 0.4 | 1.2 |
| Unemployment rate and changes | m/m% | Changes (ar) | ||||
| EU-U 000s | 0.6% | 0.9% | 0.5% | 2.0% | 4.3% | 15.8% |
| EMU-U 000s | 0.4% | 0.7% | 0.3% | 1.4% | 3.4% | 13.3% |
| U-Rates | Level | Simple Changes | ||||
| Germany | 7.5 | 7.5 | 7.5 | 0 | -0.1 | 0.2 |
| France | 10.1 | 10 | 10 | 0.1 | 0.4 | 1.2 |
| Spain | 19 | 18.9 | 18.9 | 0 | 0.3 | 2.3 |
| USA | 9.7 | 9.7 | 10 | -0.3 | 0 | 1.5 |
| Japan | 4.9 | 4.9 | 5.2 | -0.4 | -0.5 | 0.5 |
by Tom MoellerApril 30,2010
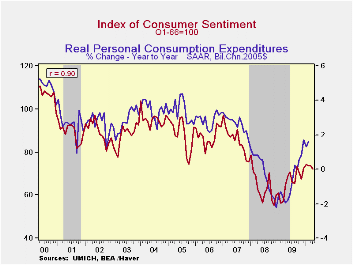
The University of Michigan reported that its index of consumer sentiment for the full month of April slipped from March to 72.2. That was, however, improved from the mid-month reading of 69.5 and was up considerably from the low late in 2008. The figure was slightly higher than Consensus expectations. The index reached a high of 74.4 this past January. During the last ten years there has been a 90% correlation between the level of sentiment and the y/y change in real consumer spending.
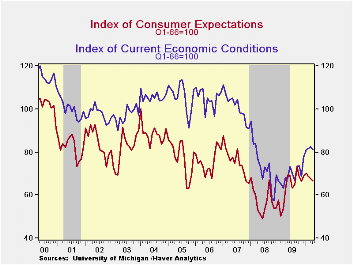
The index of expected economic conditions fell 2.1% m/m (18.6% y/y) and was down for the third straight month. Expectations for business conditions during the next five years (-4.9% y/y) as well as expectations for personal finances both fell (-6.9% y/y). Expected business conditions during the next year (+48.1 y/y) improved.
Sentiment about current economic conditions also fell moderately (+18.6% y/y) from March. The assessment of current personal finances (8.6% y/y) fell moderately and buying conditions for large household goods, including furniture, refrigerators, stoves & televisions (25.7% y/y), also fell after an unchanged March reading.
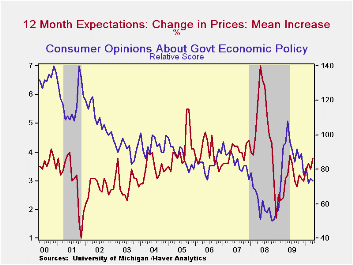
Expected price inflation during the next year increased to 3.8% and was up from the December 2008 reading of 1.7%.Respondents' view of government policy, which may eventually influence economic expectations, fell m/m and was down 32.4% from its high last May. Thirteen percent of respondents thought that a good job was being done by government versus 40% who thought a poor job was being done, a twelve-month high.
| University of Michigan | April | Mid-April | March | February | April y/y | 2009 | 2008 | 2007 |
|---|---|---|---|---|---|---|---|---|
| Consumer Sentiment | 72.2 | 69.5 | 73.6 | 73.6 | 10.9% | 66.3 | 63.8 | 85.6 |
| Current Conditions | 81.0 | 80.7 | 82.4 | 81.8 | 18.6 | 69.6 | 73.7 | 101.2 |
| Expectations | 66.5 | 62.3 | 67.9 | 68.4 | 5.4 | 64.1 | 57.3 | 75.6 |
by Tom Moeller April 30,2010
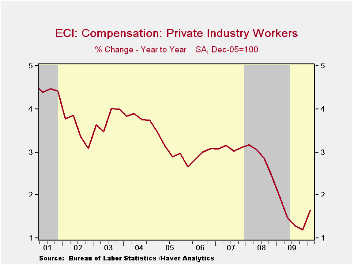
After sharp deterioration last year, the employment cost index for private industry workers gained 0.6% last quarter which was the largest increase since 2008. (The series dates back to 1980). The increase outpaced Consensus expectations for a 0.5% gain.
Total benefit costs in the private sector improved 1.4% during 1Q, the most for any quarter in five years. The gain included sales and office workers (2.0% y/y), construction & maintenance workers (3.1% y/y) and production & material handling employees (3.3% y/y). The cost of health benefits was an improved 4.5% in the latest 12 months.
Growth in wages worked the other way from benefits and moderated to 0.4%. Management, professional & related worker wages improved (1.4% y/y) while sales & office worker wages gained just 0.2% (1.7% y/y). Production & material handling worker wages ticked up just 0.2% (1.5% y/y), the least on record.
The employment cost index figures are available in Haver's USECON database.
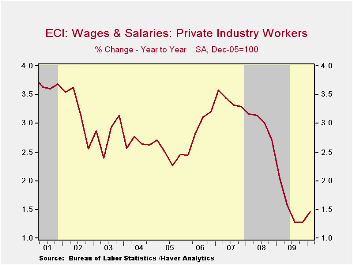
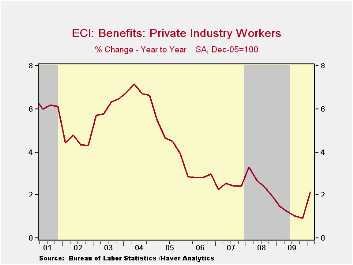
| ECI - Private Industry Workers (%) | 1Q '10 | 4Q '09 | 3Q '09 | 1Q y/y | 2009 | 2008 | 2007 |
|---|---|---|---|---|---|---|---|
| Compensation | 0.6 | 0.4 | 0.4 | 1.6 | 1.5 | 2.8 | 3.1 |
| Wages & Salaries | 0.4 | 0.5 | 0.5 | 1.5 | 1.5 | 3.0 | 3.4 |
| Benefit Costs | 1.4 | 0.3 | 0.3 | 2.1 | 1.2 | 2.6 | 2.4 |

Tom Moeller
AuthorMore in Author Profile »Prior to joining Haver Analytics in 2000, Mr. Moeller worked as the Economist at Chancellor Capital Management from 1985 to 1999. There, he developed comprehensive economic forecasts and interpreted economic data for equity and fixed income portfolio managers. Also at Chancellor, Mr. Moeller worked as an equity analyst and was responsible for researching and rating companies in the economically sensitive automobile and housing industries for investment in Chancellor’s equity portfolio. Prior to joining Chancellor, Mr. Moeller was an Economist at Citibank from 1979 to 1984. He also analyzed pricing behavior in the metals industry for the Council on Wage and Price Stability in Washington, D.C. In 1999, Mr. Moeller received the award for most accurate forecast from the Forecasters' Club of New York. From 1990 to 1992 he was President of the New York Association for Business Economists. Mr. Moeller earned an M.B.A. in Finance from Fordham University, where he graduated in 1987. He holds a Bachelor of Arts in Economics from George Washington University.
More Economy in Brief


