 Global| Aug 27 2020
U.S. GDP Fell Less in Q2'20 than First Estimate; Corporate Profits Fall
by:Sandy Batten
|in:Economy in Brief
Summary
• Q2 GDP fell less than the first estimate but this was still the largest quarterly decline on record. • Profits posted their second consecutive double-digit quarterly decline though smaller in Q2 than in Q1. • Decline still led by [...]
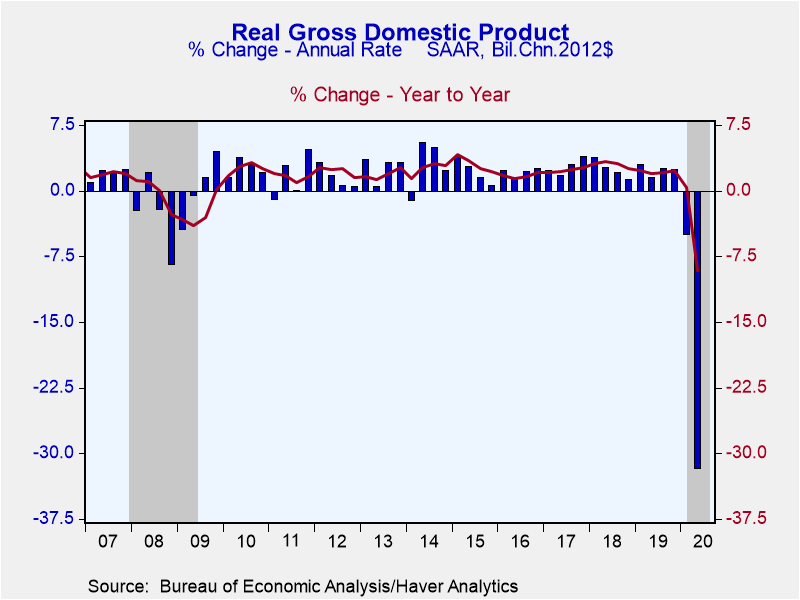
• Q2 GDP fell less than the first estimate but this was still the largest quarterly decline on record.
• Profits posted their second consecutive double-digit quarterly decline though smaller in Q2 than in Q1.
• Decline still led by slump in services consumption.
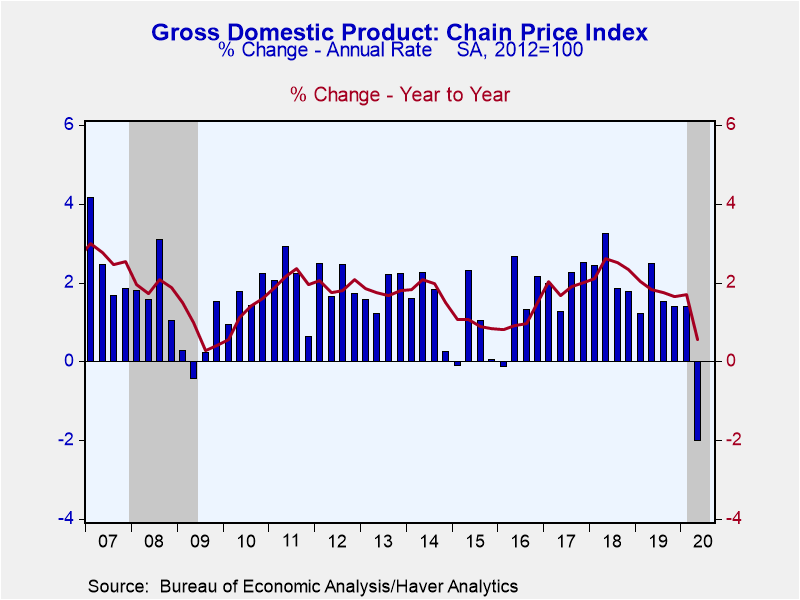
• Chain price index fell more than in the first estimate.
The second estimate of Q2 U.S. real GDP showed that economic activity plunged 31.7% q/q (SAAR), up slightly from the initially reported 32.9% decline. The revised figure was still the largest quarterly decline on record dating back to 1947. The Action Economics Forecast survey had looked for only a slight upward revision to -32.6%. Monthly indicators are pointing to a rebound in economic activity in the third quarter.
This revision contained the first look at corporate profits in Q2. Corporate profits before tax with inventory valuation (IVA) and capital consumption adjustments (CCA) fell $226.8 billon (-11.1% q/q not annualized) in the second quarter. This was the second consecutive double-digit quarterly drop, following a 12.0% q/q not annualized decline in Q1. These are the largest quarterly drops in profits since 2008 Q4 in the midst of the global financial crisis. Profits after tax with IVA and CCA fell 11.8% q/q in Q2 after a 11.0% fall in Q1. Before-tax profits in domestic sectors fell 8.4% q/q in Q2 while rest-of-world profits slumped 20.3% q/q. In the domestic economy, financial sector profits rebounded, rising 9.2% q/q, while nonfinancial sector profits fell 15.0%.
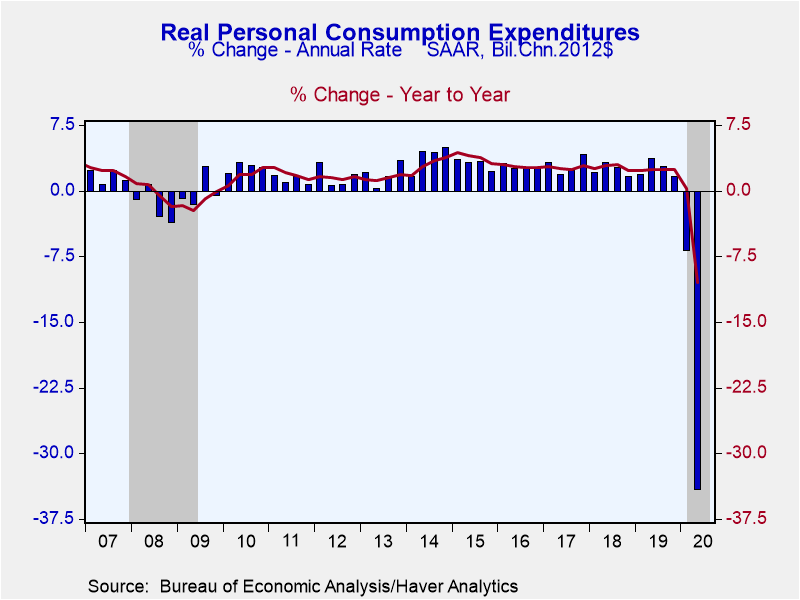
The slump in domestic final sales was lowered slightly to -28.5% q/q (SAAR) from -29.3%. The Q2 decline continued to be led by a 34.1% collapse in consumer spending (initially -34.6%) which reflected a 10.6% decline in spending on goods and a 43.1% cratering in spending on services. The quarterly decline in spending on services was 14 times larger than in any other quarter on record.
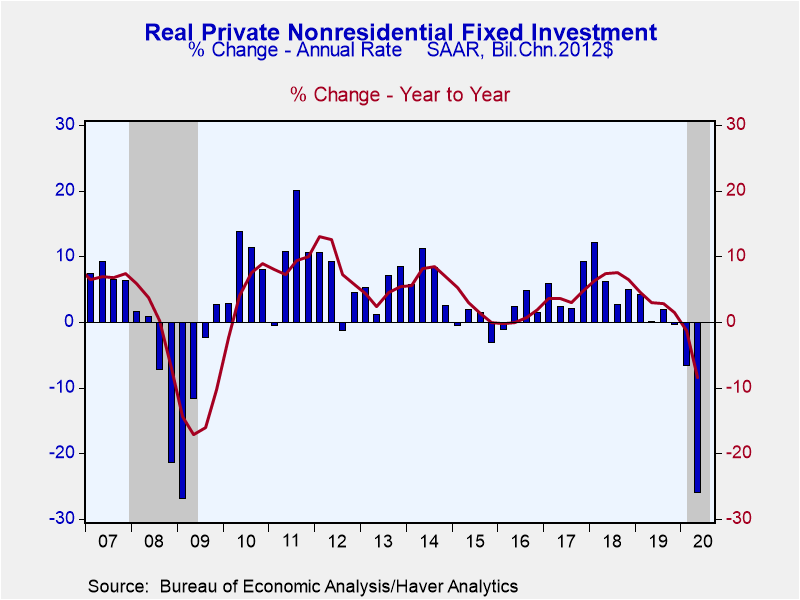
Nonresidential business fixed investment declined 26.0% revised from -27.0%. Outlays for structures outlays were off 33.4% (vs -34.9% initially). Equipment outlays plummeted 35.9%, revised from -37.7%. Investment in information processing equipment increased 29.0% q/q while spending on transportation equipment plunged 84.9%. The initially reported 7.2% q/q decline in spending on intellectual property products was revised lower to -7.7%. The initially reported 38.7% q/q decline in residential investment was revised to -37.9%
Government spending rose 2.8% in the second estimate vs. 2.7% initially. This reflected a 40.1% jump in nondefense federal government spending (initially 39.7%) while spending by cash-strapped state and local governments fell 5.5% q/q (initially -5.6%).
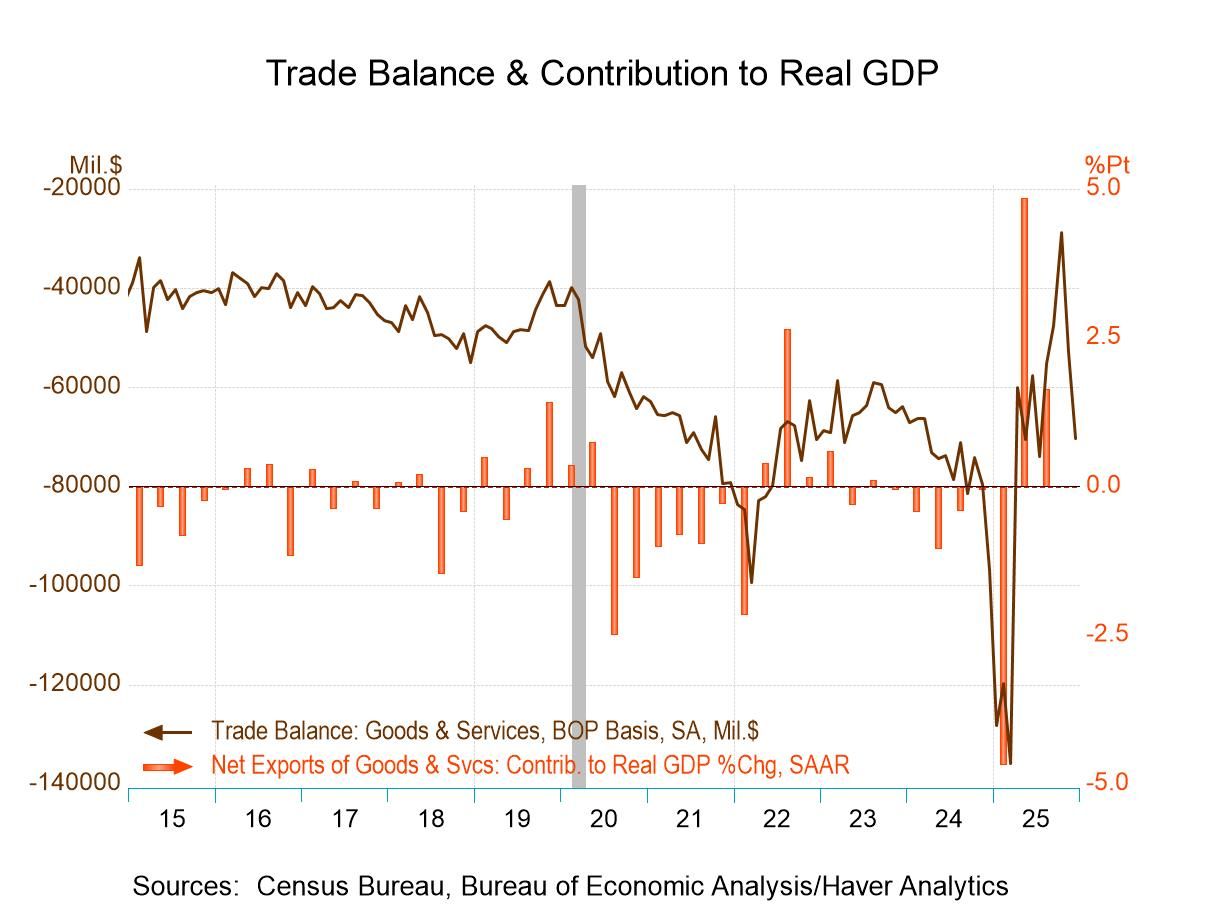
Inventory liquidation was smaller in the second estimate and so, subtracted a little less from GDP , -3.5%-points vs. the initial estimate of -4.0%-points. The foreign trade deficit narrowed more in the second estimate than it had in the first and thereby added 0.9%-point vs. the initially estimated 0.7%-point. Exports declined slightly less in the second estimate (-63.2% vs. -64.1%) while imports declined slightly more (-54.0% vs. -53.4%).
The GDP price index fell 2.0% (SAAR) in Q2 vs. the initial estimate of a 1.8% decline. This was the first quarterly decline since 2016 Q1. The PCE price index fell 1.8% vs. the initial estimate of -1.9% and excluding food and energy, the core PCE price index fell 1.0% vs. -1.1% in the first estimate. Price of nonresidential investment edged up 0.9% q/q vs. the initial estimate of 0.7%, and prices of residential investment increased 1.5% vs. 1.1%.
The GDP figures can be found in Haver's USECON and USNA database. USNA contains virtually all of the Bureau of Economic Analysis' detail in the national accounts. Both databases include tables of the newly published not seasonally adjusted data. The Action Economics consensus estimates can be found in AS1REPNA.
New Economic Challenges and the Fed's Monetary Policy Review is the title of today's speech by Fed Chairman Jerome H. Powell and it can be found here.
| Chained 2012 $ (%, AR) | Q2'20 (2nd Estimate) | Q2'20 (Advance Estimate) | Q1'20 | Q4'19 | Q2'20 Y/Y | 2019 | 2018 | 2017 |
|---|---|---|---|---|---|---|---|---|
| Gross Domestic Product | -31.7 | -32.9 | -5.0 | 2.4 | -9.1 | 2.3 | 2.9 | 2.4 |
| Inventory Effect (%-point) | -3.5 | -4.0 | -1.3 | -0.8 | -1.5 | 0.1 | 0.1 | 0.1 |
| Final Sales | -28.5 | -29.3 | -3.6 | 3.2 | -7.6 | 2.2 | 2.8 | 2.3 |
| Foreign Trade Effect (%-point) | 0.9 | 0.7 | 1.1 | 1.5 | 0.3 | -0.1 | -0.2 | -0.2 |
| Domestic Final Sales | -27.7 | -28.2 | -4.6 | 1.6 | -7.9 | 2.3 | 3.0 | 2.5 |
| Demand Components | ||||||||
| Personal Consumption Expenditure | -34.1 | -34.6 | -6.9 | 1.6 | -10.5 | 2.6 | 3.0 | 2.6 |
| Nonresidential Fixed Investment | -26.0 | -27.0 | -6.7 | -0.3 | -8.5 | 2.1 | 6.4 | 4.4 |
| Residential Investment | -37.9 | -38.7 | 19.0 | 5.8 | -4.9 | -1.5 | -1.5 | 3.5 |
| Government Spending | 2.8 | 2.7 | 1.3 | 2.4 | 2.1 | 2.3 | 1.7 | 0.7 |
| Chain-Type Price Index | ||||||||
| GDP | -2.0 | -1.8 | 1.4 | 1.4 | 0.6 | 1.8 | 2.4 | 1.9 |
| Personal Consumption Expenditure | -1.8 | -1.9 | 1.3 | 1.5 | 0.6 | 1.4 | 2.1 | 1.8 |
| Less Food & Energy | -1.0 | -1.1 | 1.6 | 1.3 | 1.3 | 1.6 | 1.9 | 1.6 |
| Nonresidential Investment | 0.9 | 0.7 | 1.0 | -0.4 | 0.5 | 1.2 | 1.4 | 1.0 |
| Residential Investment | 1.5 | 1.1 | 2.3 | 2.4 | 2.3 | 2.9 | 5.6 | 4.5 |
Sandy Batten
AuthorMore in Author Profile »Sandy Batten has more than 30 years of experience analyzing industrial economies and financial markets and a wide range of experience across the financial services sector, government, and academia. Before joining Haver Analytics, Sandy was a Vice President and Senior Economist at Citibank; Senior Credit Market Analyst at CDC Investment Management, Managing Director at Bear Stearns, and Executive Director at JPMorgan. In 2008, Sandy was named the most accurate US forecaster by the National Association for Business Economics. He is a member of the New York Forecasters Club, NABE, and the American Economic Association. Prior to his time in the financial services sector, Sandy was a Research Officer at the Federal Reserve Bank of St. Louis, Senior Staff Economist on the President’s Council of Economic Advisors, Deputy Assistant Secretary for Economic Policy at the US Treasury, and Economist at the International Monetary Fund. Sandy has taught economics at St. Louis University, Denison University, and Muskingun College. He has published numerous peer-reviewed articles in a wide range of academic publications. He has a B.A. in economics from the University of Richmond and a M.A. and Ph.D. in economics from The Ohio State University.


