 Global| Oct 10 2007
U.S. Gasoline Prices Move Further Sideways
by:Tom Moeller
|in:Economy in Brief
Summary
The Department of Energy indicated yesterday that U.S. retail gasoline prices were $2.77 per gallon. That is down 47 cents, or 15%, from the recent high of $3.22 in the middle of May. But since the beginning of August, gasoline prices [...]
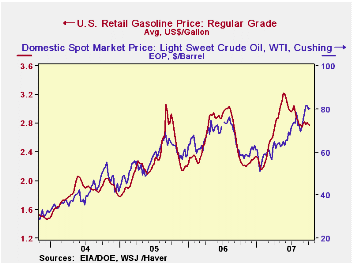
The Department of Energy indicated yesterday that U.S. retail gasoline prices were $2.77 per gallon. That is down 47 cents, or 15%, from the recent high of $3.22 in the middle of May. But since the beginning of August, gasoline prices have moved sideways.
The lack of a further decline in gasoline prices continues to reflect the positive fundamentals including low inventories of gasoline, very low gasoline production and higher crude oil prices.
It might have been hoped that the recent downtick in crude oil prices would help gasoline prices decline further. That downtick likely reflects speculation of a warm Winter in the northern hemisphere and higher OPEC production.
But WTI crude oil prices of roughly $80 per barrel remain up 15% from the recent low of $70 per barrel in early August. The recent downtick in prices is from late September highs above $83 which were held for only a few days.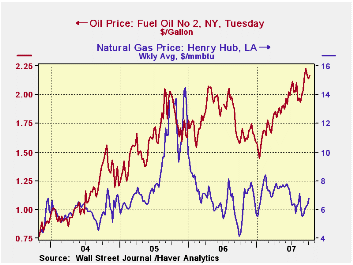
Spot market prices for home heating oil have moved slightly lower as well to $2.14 per gallon from the daily high of $2.22 reached last week. That price is, however, up from the low of $1.50 reached early this year.
Henry Hub prices for natural gas have moved higher ahead of the home heating season. The rise to 6.76 per million BTU is from the weekly low in early September. But those prices are down from last winter's high near 8.00
Energy statistics are available daily in Haver Analytics' DAILY database, weekly in WEEKLY and OILWKLY, monthly/quarterly in USECON and OGJ, and annual in OGJANN. Data from Energy Intelligence are also available in OMI, NGW and WGI.
The minutes from the latest FOMC meeting can be found here.
A Pattern of Regional Differences in the Effects of Monetary Policy from the Federal Reserve Bank of Philadelphia is available here.
| Department of Energy | 10/08/07 | 10/01/07 | September | August | 2006 | 2005 |
|---|---|---|---|---|---|---|
| Retail Gasoline ($/gallon) | 2.77 | 2.79 | 2.80 | 2.79 | 2.58 | 2.27 |
| Home Heating Oil ($/gallon) | -- | 2.14 | 2.15 | 1.96 | 1.59 | 1.63 |
| Natural Gas $/mmbtu) | -- | 6.76 | 6.06 | 6.24 | 6.74 | 8.68 |
| WTI Crude Oil ($/bbl.) | -- | 80.06 | 79.12 | 71.51 | 61.11 | 58.16 |

Tom Moeller
AuthorMore in Author Profile »Prior to joining Haver Analytics in 2000, Mr. Moeller worked as the Economist at Chancellor Capital Management from 1985 to 1999. There, he developed comprehensive economic forecasts and interpreted economic data for equity and fixed income portfolio managers. Also at Chancellor, Mr. Moeller worked as an equity analyst and was responsible for researching and rating companies in the economically sensitive automobile and housing industries for investment in Chancellor’s equity portfolio. Prior to joining Chancellor, Mr. Moeller was an Economist at Citibank from 1979 to 1984. He also analyzed pricing behavior in the metals industry for the Council on Wage and Price Stability in Washington, D.C. In 1999, Mr. Moeller received the award for most accurate forecast from the Forecasters' Club of New York. From 1990 to 1992 he was President of the New York Association for Business Economists. Mr. Moeller earned an M.B.A. in Finance from Fordham University, where he graduated in 1987. He holds a Bachelor of Arts in Economics from George Washington University.
More Economy in Brief


