 Global| Oct 10 2007
U.S. Gasoline Prices Move Further Sideways
by:Tom Moeller
|in:Economy in Brief
Summary
The Department of Energy indicated yesterday that U.S. retail gasoline prices were $2.77 per gallon. That is down 47 cents, or 15%, from the recent high of $3.22 in the middle of May. But since the beginning of August, gasoline prices [...]
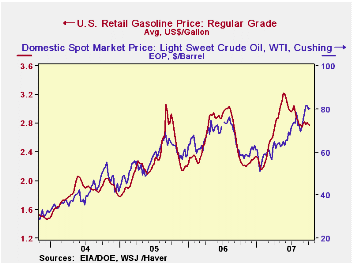
The Department of Energy indicated yesterday that U.S. retail gasoline prices were $2.77 per gallon. That is down 47 cents, or 15%, from the recent high of $3.22 in the middle of May. But since the beginning of August, gasoline prices have moved sideways.
The lack of a further decline in gasoline prices continues to reflect the positive fundamentals including low inventories of gasoline, very low gasoline production and higher crude oil prices.
It might have been hoped that the recent downtick in crude oil prices would help gasoline prices decline further. That downtick likely reflects speculation of a warm Winter in the northern hemisphere and higher OPEC production.
But WTI crude oil prices of roughly $80 per barrel remain up 15% from the recent low of $70 per barrel in early August. The recent downtick in prices is from late September highs above $83 which were held for only a few days.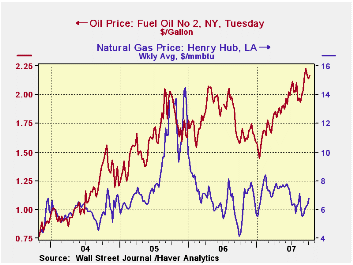
Spot market prices for home heating oil have moved slightly lower as well to $2.14 per gallon from the daily high of $2.22 reached last week. That price is, however, up from the low of $1.50 reached early this year.
Henry Hub prices for natural gas have moved higher ahead of the home heating season. The rise to 6.76 per million BTU is from the weekly low in early September. But those prices are down from last winter's high near 8.00
Energy statistics are available daily in Haver Analytics' DAILY database, weekly in WEEKLY and OILWKLY, monthly/quarterly in USECON and OGJ, and annual in OGJANN. Data from Energy Intelligence are also available in OMI, NGW and WGI.
The minutes from the latest FOMC meeting can be found here.
A Pattern of Regional Differences in the Effects of Monetary Policy from the Federal Reserve Bank of Philadelphia is available here.
| Department of Energy | 10/08/07 | 10/01/07 | September | August | 2006 | 2005 |
|---|---|---|---|---|---|---|
| Retail Gasoline ($/gallon) | 2.77 | 2.79 | 2.80 | 2.79 | 2.58 | 2.27 |
| Home Heating Oil ($/gallon) | -- | 2.14 | 2.15 | 1.96 | 1.59 | 1.63 |
| Natural Gas $/mmbtu) | -- | 6.76 | 6.06 | 6.24 | 6.74 | 8.68 |
| WTI Crude Oil ($/bbl.) | -- | 80.06 | 79.12 | 71.51 | 61.11 | 58.16 |
by Robert Brusca October 10, 2007
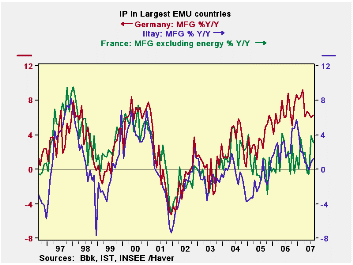
EMU growth is cropping to be strong in Q3, at least for industrial output. In France manufacturing output excluding energy is up at a 9% annualized Q/Q rate. In Germany output is up at a 7.9% rate. In Spain it’s up at an 8% rate. Even Italy shows a 4.4% rate of increase. The UK, an EU member, is showing slower IP growth in Q3 as output is up at just a 0.8% rate of increase. Sequential IP growth figures show us that growth has been accelerating in Germany, France and Italy. Spain shows sudden weakness in the most recent three months The UK shows some sporadic slowing as the recent rates of growth reveal a slow down over three months but over six months, a speed up.
On balance, despite weakening orders and slowdown assessment from Germany’s Chamber of Commerce (DIHK) and weaker surveys from the Reuters NTC survey as well as from various national surveys, actual production has been on an accelerating run. What we see is that this acceleration is counter to what surveys say they now expect. Some of the divergence reflects inter-temporal discord and mismatch. Since the financial market situation only began to turn abruptly in August before mid month, it is the reports of the next several months that should be most revealing as far as output is concerned. Up to now what we see is that, despite some weaker (and more topical) survey findings, actual output has remained firm through August for the main economies of EMU. Separately what survey data tell us is this: don’t get used to it.
| Main Euro Area Countries and UK IP in MFG | |||||||
|---|---|---|---|---|---|---|---|
| M/M | |||||||
| Aug-07 | Jul-07 | Jun-07 | 3-Month | 6-month | 12-month | Q2-Date | |
| Germany: Mfg IP | 1.8% | 0.2% | -0.3% | 7.2% | 5.6% | 6.2% | 7.9% |
| France: IP ex Construction | 0.3% | 1.7% | -0.5% | 6.3% | 3.3% | 2.6% | 9.0% |
| Italy: Mfg IP | 1.5% | 0.1% | -0.2% | 5.9% | 2.1% | 1.2% | 4.4% |
| Spain: Mfg IP | 1.3% | 1.7% | -4.2% | -5.3% | 3.9% | 0.5% | 8.0% |
| UK: Mfg IP | 0.4% | -0.2% | 0.1% | 1.2% | 3.4% | 0.6% | 0.8% |
by Robert Brusca October 10, 2007
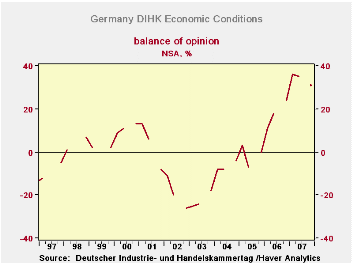
Survey backs off and points to weaker conditions ahead…
The German chamber of commerce survey (DIHK) is still strong, make no bones about that. But the survey is now off peak and clearly pointing to softer conditions ahead.Business expectations now sit at the lowest level among the respective percentiles of the components and that reading is still in the 83rdpercentile. The overall for economics conditions is in the 91stpercentile. The remaining indexes are all in their respective low 90s.
The chart on the left also looks at changes over one two and three years. (Survey reports three observations per year; plot on the chart is quarterly.) Economic conditions are up by 35 points over three years and 31 points over two years, so most of the rise has been in the last two years. In the current year the index is up by seven points compared to 31 points over two years. This is clear evidence that the rate of optimism is slowing down. The four point drop in the current quarter has not taken the year/year rise out of the series yet. The investment and hiring intention series show a similar slowing in the optimism in the past year after an outsized gain of the year before.
DIHK shows that while readings remain elevated, a slowing of some degree is in prospect.
by Carol Stone October 10, 2007
Last Friday, we wrote here about the current ECB survey of bank lending policies. A couple of weeks ago, the Bank of England published the first results of a similar, brand new survey of bank and nonbank lenders in the UK. These survey results for Q2 and Q3 were published together on September 26 and they were added to Haver's UK database this past Monday. Survey questions cover secured loans to households and small business, unsecured loans to households and small business and overall lending to corporations, each queried for the lenders' experience over the past three months and their expectations for the coming three months. The Q2 survey was taken between May 21 and June 14 and Q3 between August 20 and September 13. Here is a brief summary of what the survey showed. Keep in mind that there are just two datapoints for each item so far; responses are shown as net balance figures compiled from a 5-point rating scheme: down or negative a lot, down a little, unchanged, up a little and up a lot.
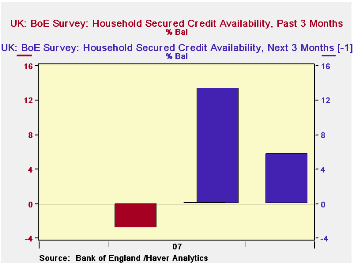
Secured Lending to Households. Lenders reported in June that they had reduced the availability of secured credit to households just slightly during the spring, with a reading of -2.9 on this question. They expected then to increase availability distinctly over the summer, with a "next 3 months" reading of +13.4. However, by the September survey dates, it turns out that this credit supply was basically unchanged, at +0.1, but lenders still expect to be somewhat more liberal in the coming months, at +5.8. Changes in the economic outlook and in the lenders' views on risk are the main factors making secured credit less available than expected in Q3. On the demand side, developments were mixed: demand for credit for house purchase, whether for owner-occupied or "buy-to-let", was stronger (or less weak) than expected in Q3, but demand for "remortgaging" and other secured credit was less than expected. Other survey questions cover pricing, including both spreads and fees and other lending terms.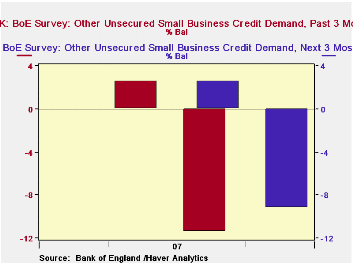
Unsecured Lending to Households. In June, lenders said they had been restrictive on balance in granting unsecured credit to households during Q2, with a reading of -14.3, but they were planning to be more liberal, at +4.9, over the summer. However, as it turned out, they remained restrictive in Q3, again showing a double-digit negative, at -10.2. Further, they expected to remain a little tight in Q4 at -2.9. At the same time, the proportion of loan applications approved has gone up. Compared with the expectation of +5.2, the Q3 outcome was +15.0; both credit card and "other" unsecured loan categories had this general pattern. Demand for this type of borrowing was mildly weaker than expected, showing slightly negative readings in contrast to expectations of small positives. Small business credit demand was more clearly negative than expected. Pricing, i.e., spreads, was more favorable for lending in Q3 than in Q2 and also more favorable than had been expected.
Lending to Corporations. Major business lending policies were significantly more restrictive in Q3 than they had been in Q2 and also than they were expected to be then. Credit availability was +1.8 in Q2 and anticipated to be flat in Q3. Instead, it was -20.2 in Q3 and it is expected to become much more restricted in Q4 at -49.3. All factors on credit supply which are queried on the survey were more negative in the later polling. These include sector-specific risks and pressure from capital markets, as well as more general factors also queried with household lending: economic outlook, appetite for risk, cost and availability of funding and market share objectives. Loan demand from both large and medium-size nonfinancial corporations (PNFCs) became weaker over the summer. That from "other financial corporations" (OFCs) generally went from flat or modestly positive to modestly negative. Balance sheet restructuring and a slowing commercial real estate market are seen as the factors impinging most on the demand shifts.
In our third graph, we show one of the non-price features of lending policy, the lender's fees and commissions. The graph shows the impact of this on credit volume, so the positive bars indicate a reduction in fees and the negative bars show a increase. Thus, these survey results say that lenders had cut their fees in Q2 and expected to do so again in Q3. But instead they raised their fees -- discouraging borrowing -- and intend to do so even more in Q4.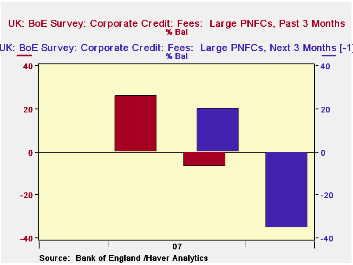
As is evident from these overly terse comments, this survey is comprehensive, covering many of the determinants of credit supply and demand at lending institutions. The Bank of England points out that when data on flows and outstandings are examined, it is not possible to tell whether a change is due to supply or demand factors. This survey will help considerably to assess those developments, and as we see here, they are not uniform over credit sectors, so the three-part survey is a most helpful approach. The present results are too sketchy, though, to compare with actual lending patterns. It will take time to accumulate results that permit matching survey readings, such as a +10 or a -20, with specific loan volumes. We wish we could do that now!

Tom Moeller
AuthorMore in Author Profile »Prior to joining Haver Analytics in 2000, Mr. Moeller worked as the Economist at Chancellor Capital Management from 1985 to 1999. There, he developed comprehensive economic forecasts and interpreted economic data for equity and fixed income portfolio managers. Also at Chancellor, Mr. Moeller worked as an equity analyst and was responsible for researching and rating companies in the economically sensitive automobile and housing industries for investment in Chancellor’s equity portfolio. Prior to joining Chancellor, Mr. Moeller was an Economist at Citibank from 1979 to 1984. He also analyzed pricing behavior in the metals industry for the Council on Wage and Price Stability in Washington, D.C. In 1999, Mr. Moeller received the award for most accurate forecast from the Forecasters' Club of New York. From 1990 to 1992 he was President of the New York Association for Business Economists. Mr. Moeller earned an M.B.A. in Finance from Fordham University, where he graduated in 1987. He holds a Bachelor of Arts in Economics from George Washington University.
More Economy in Brief


