 Global| Oct 19 2009
U.S. FY '09 Federal Budget DeficitTops $1.4 Trillion
by:Tom Moeller
|in:Economy in Brief
Summary
The U.S. government ran a budget deficit of $1.417 trillion during Fiscal Year 2009. The figure was by far a record and more than tripled the 2008 deficit of $454.8 billion. While somewhat below the Congressional Budget Office's [...]
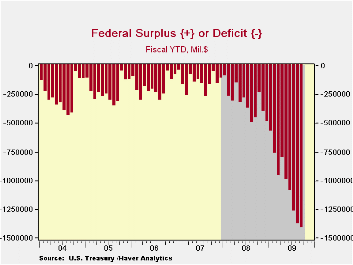 The U.S. government ran a
budget deficit of $1.417 trillion
during Fiscal Year 2009. The figure was by far a record and more than
tripled the 2008 deficit of $454.8 billion. While somewhat below the
Congressional Budget Office's recent estimate for a deficit of $1.7
trillion, it nevertheless reached roughly 10% of GDP, the largest since
1945.
The U.S. government ran a
budget deficit of $1.417 trillion
during Fiscal Year 2009. The figure was by far a record and more than
tripled the 2008 deficit of $454.8 billion. While somewhat below the
Congressional Budget Office's recent estimate for a deficit of $1.7
trillion, it nevertheless reached roughly 10% of GDP, the largest since
1945.
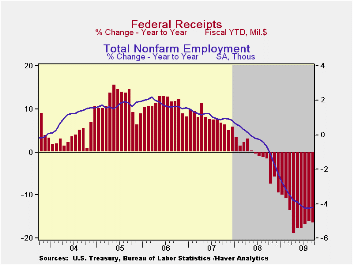
The recession in the U.S. economy drove the deficit higher last year as revenues lagged sharply and spending increased. Net revenues during FY09 were down 16.6% from FY08. Individual income tax receipts fell 20.1% reflecting higher unemployment while corporate tax receipts fell by more than one-half as profits dried up. Social security contributions fell for the first time since 1995 and estate & gift taxes fell 18.6% after 10.8% growth last fiscal year.
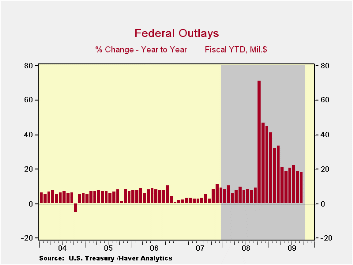
 The wars in Iraq & Afghanistan and the U.S. recession
boosted overall Federal spending by 18.2% versus FY08, double last
year's growth. Defense spending (19% of total outlays) rose 7.1% during
FY09. Though outlays for military personnel rose just 6.1% last year
after 8.9% growth during FY08, Army procurement jumped 15.8% after
36.9% growth during '08. On the home front, growth in Medicare
expenditures (12% of outlays) doubled and "income security" spending
(11% of outlays) jumped by one-quarter with higher unemployment. Social
security payments rose an elevated 10.7% but net interest payments
continued to fall sharply with lower interest rates.
The wars in Iraq & Afghanistan and the U.S. recession
boosted overall Federal spending by 18.2% versus FY08, double last
year's growth. Defense spending (19% of total outlays) rose 7.1% during
FY09. Though outlays for military personnel rose just 6.1% last year
after 8.9% growth during FY08, Army procurement jumped 15.8% after
36.9% growth during '08. On the home front, growth in Medicare
expenditures (12% of outlays) doubled and "income security" spending
(11% of outlays) jumped by one-quarter with higher unemployment. Social
security payments rose an elevated 10.7% but net interest payments
continued to fall sharply with lower interest rates.
Net outlays under the Government's Troubled Asset Relief Program (TARP) started to fall by the end of FY09 but, for the fiscal year as a whole, they amounted to $333.3B. The U.S. Treasury has adopted the view that these TARP expenditures should be counted like any other spending. When the banks repay the Treasury, these funds will be counted as revenue. Accounted for in this way, TARP causes a surge in the budget deficit when the funds are distributed to the banks, but leads to a smaller deficit, or perhaps a surplus, when repayments are received.
 The Government's financial data are available in Haver's USECON
database, with extensive detail available in the specialized GOVFIN.
The Government's financial data are available in Haver's USECON
database, with extensive detail available in the specialized GOVFIN.
The Office of Management & Budget's 2010 Budget can be found here.
The Budget & Economic Outlook: An Update from the Congressional Budget Office can be found here.
| US Government Finance | FY 2009 | FY 2008 | FY 2007 | FY 2006 |
|---|---|---|---|---|
| Budget Balance | -$1,417.1B | -$454.8B | -$161.5B | -$248.197B |
| as a percent of GDP | -10.0% | -3.2% | -1.2% | -1.9% |
| Net Revenues (Y/Y % Change) | -16.6% | -1.7% | 6.7% | 11.8% |
| Individual Income Taxes | -20.1 | -1.5 | 11.5 | 12.6 |
| Corporate Income Taxes | -54.6 | -17.8 | 4.6 | 27.2 |
| Social Insurance Taxes | -1.0 | 3.5 | 3.8 | 5.5 |
| Net Outlays (Y/Y % Change) | 18.2 | 9.1 | 2.8 | 7.4 |
| Nat'l Defense | 7.6 | 11.8 | 4.1 | 6.9 |
| Health | 19.1 | 5.4 | 5.5 | 0.8 |
| Medicare | 10.1 | 4.1 | 13.8 | 10.5 |
| Income Security | 24.9 | 16.8 | 3.5 | 2.3 |
| Social Security | 10.7 | 5.3 | 6.9 | 4.8 |
| Interest | -24.5 | 6.3 | 5.0 | 23.2 |
by Robert Brusca October 19, 2009
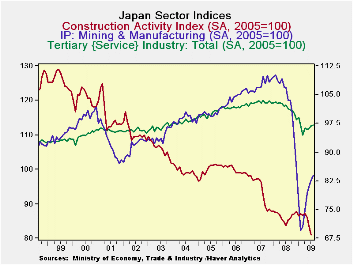
Japan’s Tertiary index (service sector index) rose in August
for the third month in a row. The chart above puts these increases in
perspective. While a nice, stable uptrend is emerging, the pace of the
rise is relatively moderate; yet the level of the index is well short
of the past cycle peak.
The mining/MFG index fell extremely sharply in the depth of
the recession and while it has had a very sharp bounce back, it is too
soon to tell if the bounce-back will be complete. At a level of 83.9
the mining/MFG index is up sharply from its low of 69.5 but is still
‘light-years’ away from the past peak at 110.1.
The rebound in the various sector indices is a good sign for
Japan’s beleaguered economy. Even so these bounces have a long way to
go to restore Japan to its precession levels of activity.
| Up to date Japan Industry Survey | |||||||||
|---|---|---|---|---|---|---|---|---|---|
| Recent Months | Moving Averages | Extremes; Range | |||||||
| Aug-2009 | Jul-2009 | Jun-2009 | 3-Mo | 6-Mo | 12-Mo | Max | Min | %-Tile | |
| Mining and MFG | 83.9 | 82.6 | 80.9 | 82.5 | 78.7 | 83.4 | 110.1 | 69.5 | 35.5% |
| Tertiary | 97.1 | 96.8 | 96.1 | 96.7 | 96.1 | 97.8 | 103.5 | 89.1 | 55.6% |
| Ranges, Max, Min since 1993 | |||||||||
by Louise Curley October 19, 2009
 While
purchasing power parity (PPP) is not a major factor in determining a
country's actual exchange rate, it can be used as a rough guide in
deciding whether a particular currency is under or over
valued. Most developing countries with growing
current account balances, have preferred to pile up foreign exchange
reserves rather than let their currencies appreciate.
Meanwhile, the purchasing power parity of their currencies has
generally increased slowly and steadily as their economies have
prospered. As a result their currencies have continued to be
undervalued.
While
purchasing power parity (PPP) is not a major factor in determining a
country's actual exchange rate, it can be used as a rough guide in
deciding whether a particular currency is under or over
valued. Most developing countries with growing
current account balances, have preferred to pile up foreign exchange
reserves rather than let their currencies appreciate.
Meanwhile, the purchasing power parity of their currencies has
generally increased slowly and steadily as their economies have
prospered. As a result their currencies have continued to be
undervalued.
Data on the purchasing power parity of currencies can be
derived from data in the Haver data base, The World
Development Indicators. 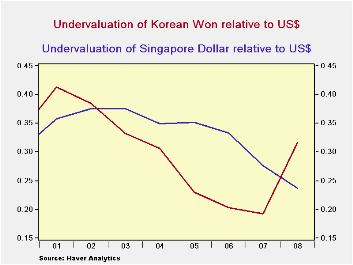 The data are annual so the
latest data point is 2008. PPP conversion factors for the
world countries are included in the section "Exchange Rates and
Prices". We chose four countries as examples:
China, Korea, Singapore and Brazil and the PPP Conversion
Factor (GDP) to market exchange rate ratio.
The data are annual so the
latest data point is 2008. PPP conversion factors for the
world countries are included in the section "Exchange Rates and
Prices". We chose four countries as examples:
China, Korea, Singapore and Brazil and the PPP Conversion
Factor (GDP) to market exchange rate ratio.
The conversion
factor is the ratio of PPP exchange rate to the actual exchange rate.
One minus the conversion factor, therefore is the percentage of under
or over valuation of the particular exchange rate relative to the
dollar. Thus for Korea, the conversion factor of
.684 in 2008 means that the Korea's actual exchange rate was 31.6%
undervalued relative to the dollar. 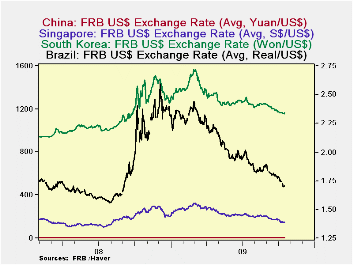 Since the actual exchange
rate is 1102.09 Won/$, a conversion factor of .684 means that the PPP
exchange rate is 753.98 Won/$ (.684 * 1102.09). The actual
exchange rates, the PPP exchange rates and the percent of
undervaluation of the currencies of the four countries are shown in the
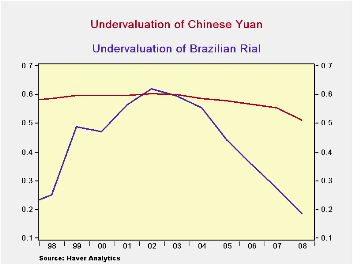
table below.· Brazil has allowed its currency to appreciate
considerably. From an undervaluation of 61.9 in 2002, the
Rial was only 18.4% undervalued in 2008, as shown in the first
chart. By contrast, China has permitted only moderate
appreciation of the yuan as shown in the same chart. The Singapore
dollar has steadily reduced its undervaluation as can be seen in the
second chart. Korea, on the other hand experienced a sharp
increase in its undervaluation in 2008, also shown in the second
chart.
Since the actual exchange
rate is 1102.09 Won/$, a conversion factor of .684 means that the PPP
exchange rate is 753.98 Won/$ (.684 * 1102.09). The actual
exchange rates, the PPP exchange rates and the percent of
undervaluation of the currencies of the four countries are shown in the
table below.· Brazil has allowed its currency to appreciate
considerably. From an undervaluation of 61.9 in 2002, the
Rial was only 18.4% undervalued in 2008, as shown in the first
chart. By contrast, China has permitted only moderate
appreciation of the yuan as shown in the same chart. The Singapore
dollar has steadily reduced its undervaluation as can be seen in the
second chart. Korea, on the other hand experienced a sharp
increase in its undervaluation in 2008, also shown in the second
chart.
The third chart brings up to date the actual exchange
rates of the four countries. They have, to varying degrees,
appreciated in 2009. Again, the Chinese Yuan has appreciated
the least and the Brazilian Real, the most.
| 2008 | 2007 | 2006 | 2005 | 2004 | 2003 | 2002 | |
|---|---|---|---|---|---|---|---|
| China | |||||||
| Actual exchange rate (Yuan/$) | 6.95 | 7.61 | 7.97 | 8.19 | 8.28 | 8.28 | 8.28 |
| PPP exchange rate | 3.39 | 3.38 | 3.46 | 3.45 | 3.43 | 3.29 | 3.28 |
| Undervaluation (%) (1-Conversion factor) | 51.1 | 55.5 | 56.6 | 57.9 | 58.6 | 60.1 | 60.3 |
| Korea | |||||||
| Actual exchange rate (Won/$) | 1102.1 | 929.3 | 954.8 | 1024.1 | 1145.3 | 1191.1 | 1251.1 |
| PPP exchange rate | 754.0 | 747.9 | 760.7 | 788.9 | 794.3 | 795.7 | 769.8 |
| Undervaluation (%) (1-Conversion factor) | 31.5 | 19.3 | 20.3 | 23.0 | 30.7 | 32.2 | 38.5 |
| Singapore | |||||||
| Actual exchange rate (S$/US$) | 1.41 | 1.51 | 1.59 | 1.66 | 1.69 | 1.74 | 1.79 |
| PPP exchange rate | 1.08 | 1.09 | 1.06 | 1.08 | 1.10 | 1.09 | 1.12 |
| Undervaluation (%) (1-Conversion factor) | 23.7 | 27.7 | 33.3 | 35.7 | 34.9 | 37.6 | 37.5 |
| Brazil | |||||||
| Actual exchange rate (Rial/$) | 1.83 | 1.94 | 2.18 | 2.43 | 2.93 | 3.08 | 2.93 |
| PPP exchange rate | 1.50 | 1.41 | 1.40 | 1.36 | 1.31 | 1.22 | 1.11 |
| Undervaluation (%) (1Conversion factor) | 18.4 | 27.6 | 35.8 | 44.2 | 55.3 | 57.6 | 61.9 |
by Tom Moeller October 19, 2009
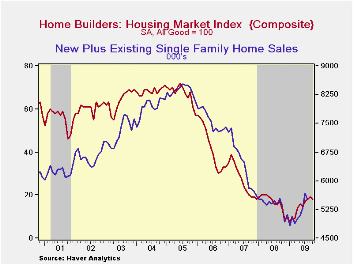
Housing continues to turn the corner toward recovery, but of late that recovery stuttered. The National Association of Home Builders reported that its October Composite Housing Market Index fell to 18 from 19 in September. Though the index remained double the low of 8 this past January, it's rate of improvement has slowed since the Spring. The index is compiled from survey questions asking builders to rate market conditions as “good”, “fair”, “poor” or “very high” to “very low”. The figure is a diffusion index, therefore, numerical results over 50 indicate a predominance of “good” readings.
The sub-index of sales during the next six months fell to 27 which was the lowest level since August. The present sales index also fell to 17 which equaled the 3Q average. Much of easing in the October composite index was due to a sharp decline in the West (+27.3% y/y). In the Midwest (+30.5% y/y) and in the South (+12.5% y/y) the index fell slightly while in the Northeast (+56.3% y/y) there was a continued gain.
The Home Builders' Association also reported that traffic of prospective buyers slipped during October after firm gains this past Spring and Summer.
The Home Builders' Housing Opportunity Index, which is the
share of homes sold that could be considered affordable to a family
earning the median income, fell slightly in the second quarter. It had
jumped earlier to a record high of 72.5% buoyed by lower home prices,
lower interest rates and higher income. (There is a break in the series
from 2002 to 2003.)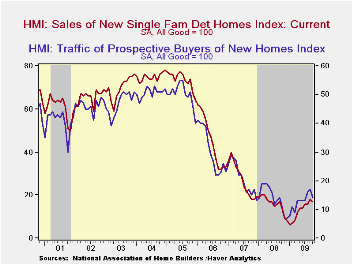
The NAHB has compiled the Housing Market Index since 1985. The weights assigned to the individual index components are .5920 for single family detached sales, present time; .1358 for single family detached sales, next six months; and .2722 for traffic of prospective buyers. The results, along with other housing and remodeling indexes from NAHB Economics, are included in Haver’s SURVEYS database.
Asia and the Global Financial Crisis is today's speech by Fed Chairman Ben S. Bernanke and it can be found here.
| Nat'l Association of Home Builders | October | September | October '08 | 2008 | 2007 | 2006 |
|---|---|---|---|---|---|---|
| Composite Housing Market Index (All Good = 100) | 18 | 19 | 14 | 16 | 27 | 42 |
| Single-Family Sales | 17 | 18 | 14 | 16 | 27 | 45 |
| Single-Family Sales: Next Six Months | 27 | 29 | 19 | 25 | 37 | 51 |
| Traffic of Prospective Buyers | 14 | 17 | 11 | 14 | 21 | 30 |

Tom Moeller
AuthorMore in Author Profile »Prior to joining Haver Analytics in 2000, Mr. Moeller worked as the Economist at Chancellor Capital Management from 1985 to 1999. There, he developed comprehensive economic forecasts and interpreted economic data for equity and fixed income portfolio managers. Also at Chancellor, Mr. Moeller worked as an equity analyst and was responsible for researching and rating companies in the economically sensitive automobile and housing industries for investment in Chancellor’s equity portfolio. Prior to joining Chancellor, Mr. Moeller was an Economist at Citibank from 1979 to 1984. He also analyzed pricing behavior in the metals industry for the Council on Wage and Price Stability in Washington, D.C. In 1999, Mr. Moeller received the award for most accurate forecast from the Forecasters' Club of New York. From 1990 to 1992 he was President of the New York Association for Business Economists. Mr. Moeller earned an M.B.A. in Finance from Fordham University, where he graduated in 1987. He holds a Bachelor of Arts in Economics from George Washington University.
More Economy in Brief


