 Global| Mar 10 2014
U.S. Food Price Inflation Was Weak Last Year Following Several Years of Strength
by:Tom Moeller
|in:Economy in Brief
Summary
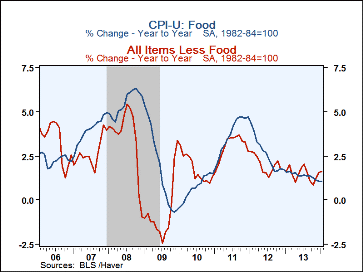
Food price increases in 2013 roughly equaled the gain in prices for other goods and services. Overall food prices rose 1.4% last year and for several months, the gain lagged the total. This was, however, a break with the trend in [...]
Food price increases in 2013 roughly equaled the gain in prices for other goods and services. Overall food prices rose 1.4% last year and for several months, the gain lagged the total. This was, however, a break with the trend in earlier years. Since 2007, food prices have risen 16.8% versus an 11.7% rise in prices elsewhere. Moreover, price increases for some products have been consistently and notably above the total.
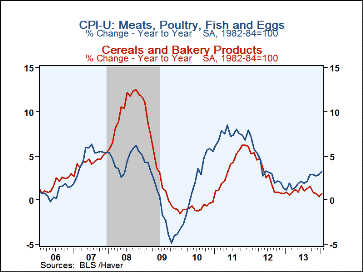
Notable strength has been in prices of meats, poultry, fish and eggs. During the last six years, prices for these items combined have risen by 20.6%. The 24.7% gain in prices for fish and seafood has led the group. That strength was followed by a 20.4% rise in meat prices and a 21.1% gain in poultry costs. Lagging the outsized increases in these three groups was a 14.8% rise in egg prices. Prices for cereals and bakery products also were strong, posting a 21.7% six-year rise.
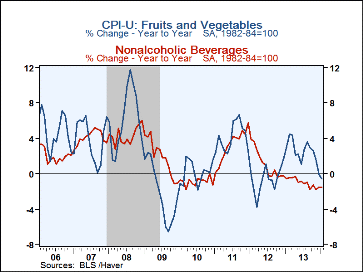
Rough weather conditions wreaked havoc on fruit and vegetable production. That raised prices by a sharp 2.5% and by four times that for lettuce. During the last six years, however, price gains in this group have totaled a moderate 10.4%. The cost of washing down food also grew moderately. Nonalcoholic beverage prices rose just 8.8% during the last six years, although coffee drinkers paid relatively more and prices rose 16.5%.
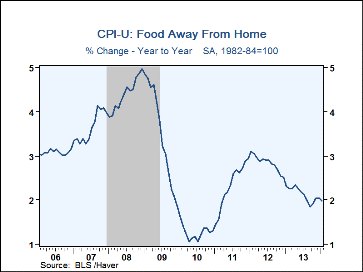
Eating out has never been cheap, given the costs of food preparation and service. Here, prices increased a strong 2.1% last year and were up a total of 17.6% during the last six years. The strongest grouping has been food service for elementary and secondary schools. Here food prices increased 23.0% since 2007.
The CPI data can be found in Haver's USECON database.
| Consumer Price Index (%) | 1 Mth. | 3 Mth. | 6 Mth. | Y/Y | 2013 | 2012 | 2011 |
|---|---|---|---|---|---|---|---|
| All Items less Food | 0.2 | 0.5 | 0.8 | 1.6 | 1.5 | 2.0 | 3.0 |
| Total Food | 0.1 | 0.3 | 0.5 | 1.0 | 1.4 | 2.6 | 3.7 |
| Food at Home | 0.1 | 0.1 | 0.2 | 0.4 | 0.9 | 2.5 | 4.8 |
| Cereals & Bakery Products | 0.5 | 0.3 | 0.3 | 0.8 | 1.0 | 2.8 | 3.9 |
| Meats | 0.3 | 0.6 | 1.3 | 2.6 | 1.2 | 3.4 | 8.8 |
| Poultry | 0.4 | -0.3 | 1.7 | 2.8 | 4.7 | 5.5 | 2.9 |
| Fish & Seafood | 1.8 | 1.2 | 4.4 | 6.0 | 2.5 | 2.4 | 7.1 |
| Eggs | -1.6 | 1.1 | -1.9 | 6.1 | 3.3 | 3.1 | 9.3 |
| Dairy & Related Products | 0.5 | 1.3 | 1.6 | -0.4 | 0.1 | 2.1 | 6.8 |
| Fruits & Vegetables | -0.3 | -1.8 | -1.5 | -0.5 | 2.5 | -0.7 | 4.1 |
| Nonalcoholic Beverages | -0.2 | -0.3 | 0.4 | -1.5 | -1.0 | 1.1 | 3.2 |
| Other Food At Home | 0.0 | 0.5 | -0.3 | -0.4 | 0.0 | 3.8 | 3.3 |
| Food Away From Home | 0.1 | 0.5 | 0.9 | 2.0 | 2.1 | 2.8 | 2.3 |
Tom Moeller
AuthorMore in Author Profile »Prior to joining Haver Analytics in 2000, Mr. Moeller worked as the Economist at Chancellor Capital Management from 1985 to 1999. There, he developed comprehensive economic forecasts and interpreted economic data for equity and fixed income portfolio managers. Also at Chancellor, Mr. Moeller worked as an equity analyst and was responsible for researching and rating companies in the economically sensitive automobile and housing industries for investment in Chancellor’s equity portfolio. Prior to joining Chancellor, Mr. Moeller was an Economist at Citibank from 1979 to 1984. He also analyzed pricing behavior in the metals industry for the Council on Wage and Price Stability in Washington, D.C. In 1999, Mr. Moeller received the award for most accurate forecast from the Forecasters' Club of New York. From 1990 to 1992 he was President of the New York Association for Business Economists. Mr. Moeller earned an M.B.A. in Finance from Fordham University, where he graduated in 1987. He holds a Bachelor of Arts in Economics from George Washington University.
More Economy in Brief
 Global| Feb 05 2026
Charts of the Week: Balanced Policy, Resilient Data and AI Narratives
by:Andrew Cates


