 Global| Sep 25 2013
U.S. Financial Accounts Show Lower Credit Market Borrowing in Q2; New Data on Consumer Credit Detail
Summary
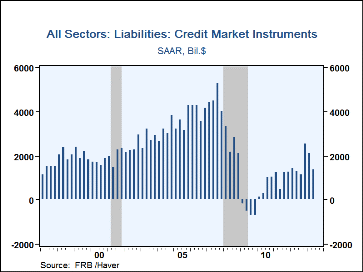
Federal Reserve financial accounts data (formerly known as the "flow of funds") for Q2 show the net volume of credit market borrowing at a $1.4 trillion annual rate, down markedly from $2.1 trillion in Q1. Q1 is moderately revised [...]
Federal Reserve financial accounts data (formerly known as the "flow of funds") for Q2 show the net volume of credit market borrowing at a $1.4 trillion annual rate, down markedly from $2.1 trillion in Q1. Q1 is moderately revised from $2.4 trillion reported in June. Q2's credit demand amounted to 8.2% of GDP, compared to 12.9% in Q1. After outsized ratios in Q4'2012 and Q1, the latest ratio is similar to what prevailed in 2011 and the first part of 2012, but still far lower than a 20-year average of 17-18%.
Lower federal government borrowing in Q2 was the main factor in the reduced borrowing total. This sector needed "just" $300 billion, compared to $1.169 trillion the prior period. This was the smallest federal government borrowing amount since Q4'2007, just before the start of the Great Recession. Recall that all these quarterly borrowing amounts are quoted at seasonally adjusted annual rates in the Fed's presentation of these data.
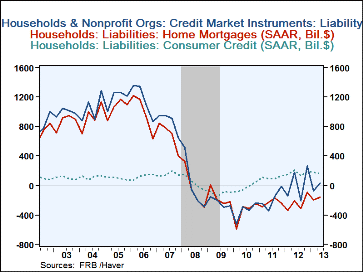
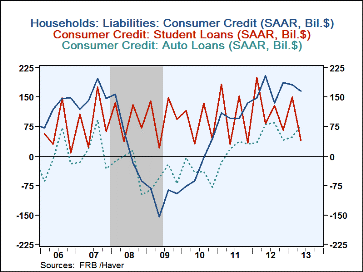
Other major sectors increased borrowing in Q2. Households used $31 billion on net, following a net liquidation of $68 billion in Q1. Their paydowns of home mortgages continued, but at $162 billion, were somewhat less than the $200 billion in Q1. Consumer credit borrowing slowed a bit to $165 billion from $180 billion, while loans from depository corporations increased $38 billion after a net decrease of $41 billion in Q1. Notably, the consumer credit data are now broken down by major category, showing that auto loans increased $78 billion in Q2 after $48 billion in Q1, while borrowing on student loans was only $39 billion after $150 billion in Q1. Credit card debt rose $10 billion in Q2, following $13 billion in Q1, and "other" consumer credit rose $38 billion on net following a paydown of $30 billion. This breakdown is given as a memo item on the consumer credit table in the Financial Accounts presentation and will also be shown on the regular monthly consumer credit release beginning in October.
Nonfinancial corporations borrowed at a $742 billion annual rate in Q2 after $538 billion in Q1. Corporate bonds were still the main vehicle, at $559 billion following $570 billion in Q1. Borrowing from depository corporations and other lenders as well as commercial mortgages picked up slightly in Q2.
The Financial Accounts data are in Haver's FFUNDS database. Associated information is compiled in the Integrated Macroeconomic Accounts produced jointly with the Bureau of Economic Analysis (BEA); these are carried in Haver's USNA database. This latest Financial Accounts release also includes new data on pension entitlements as an asset for the household sector and related data on the funding condition of defined benefit pension funds in pension fund sectors; the relevant liability line items of balances due from underlying plan sponsors, such as nonfinancial corporations and state and local governments are also shown.
Carol Stone, CBE
AuthorMore in Author Profile »Carol Stone, CBE came to Haver Analytics in 2003 following more than 35 years as a financial market economist at major Wall Street financial institutions, most especially Merrill Lynch and Nomura Securities. She had broad experience in analysis and forecasting of flow-of-funds accounts, the federal budget and Federal Reserve operations. At Nomura Securities, among other duties, she developed various indicator forecasting tools and edited a daily global publication produced in London and New York for readers in Tokyo. At Haver Analytics, Carol was a member of the Research Department, aiding database managers with research and documentation efforts, as well as posting commentary on select economic reports. In addition, she conducted Ways-of-the-World, a blog on economic issues for an Episcopal-Church-affiliated website, The Geranium Farm. During her career, Carol served as an officer of the Money Marketeers and the Downtown Economists Club. She had a PhD from NYU's Stern School of Business. She lived in Brooklyn, New York, and had a weekend home on Long Island.


