 Global| Jan 08 2007
U.S. Factory Sector Inventory Gain Dropped Sharply
by:Tom Moeller
|in:Economy in Brief
Summary
Factory inventories increased just 0.2% in November after a downwardly revised 0.3% October increase. These gains were down from the 0.7% average during the prior six months. Petroleum refineries' inventories did rise 0.7% but that [...]
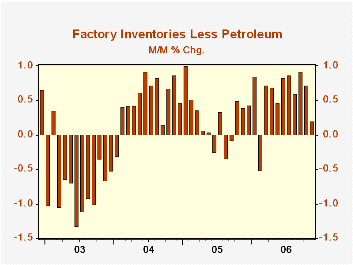
Factory inventories increased just 0.2% in November after a downwardly revised 0.3% October increase. These gains were down from the 0.7% average during the prior six months.
Petroleum refineries' inventories did rise 0.7% but that uptick followed sharp 6.3% and 4.3% declines during the prior two months due to lower oil prices. The new development in November was that less petroleum, factory inventories grew just 0.2% (7.0% y/y), down sharply from the 0.7% average of the prior six months.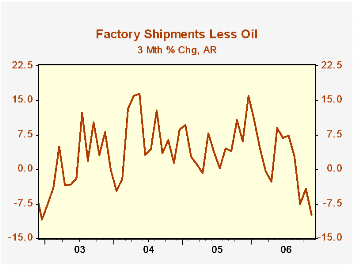
Machinery inventories fell 0.5% (+6.2% y/y) and primary metal inventories eased 0.3% (+18.9% y/y). Inventories of computers & electronic products rose 0.8% (7.2% y/y) while inventories of electrical equipment rose 0.6% (11.0% y/y) and the 3-month change fell to only 1.2% (AR). Furniture inventories rose 1.0% and in a hint that the accumulation was involuntary the 3-month change rose to 10.3%, the highest in a year.
Total factory orders recovered 0.9% after the hard October plunge. Durable goods orders jumped 1.6% which was revised down slightly from the advance report. Factory orders less transportation fell 0.5% (+0.6% y/y), the third consecutive monthly decline. Much of the recently slower growth in this measure reflects petroleum where orders (which equal shipments), but non-transportation orders less oil fell 0.9% (+1.4% y/y) in November for the fourth consecutive monthly decline.
Factory shipments rose 0.1% for the second month but factory shipments less transportation & petroleum slipped 0.2% (+1.4% y/y).
| Factory Survey (NAICS) | November | October | Y/Y | 2005 | 2004 | 2003 |
|---|---|---|---|---|---|---|
| Inventories | 0.2% | 0.3% | 7.1% | 4.0% | 6.9% | -7.4% |
| New Orders | 0.9% | -4.5% | -0.8% | 8.5% | 7.5% | 0.9% |
| Shipments | 0.1% | 0.1% | 0.7% | 7.1% | 6.8% | 0.2% |
| Unfilled Orders | 1.7% | 1.4% | 20.4% | 16.3% | 4.5% | -1.0% |
by Louise Curley January 8, 2007
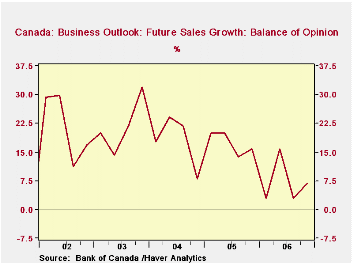
The results of the Bank of Canada's Winter Business Outlook Survey were released today. The survey is conducted by analysts at the bank's regional offices who interviews senior management of approximately 100 firms. The regional offices tally the percent of respondents who see improvement over the next twelve months, those who see deterioration and those whose see no change.The balance of opinion is the difference between those who see improvement and those who see deterioration.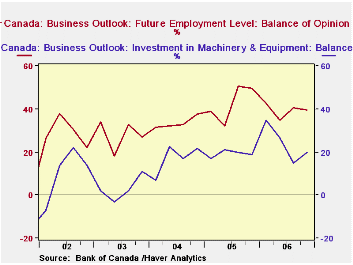
While there are bright spots in Winter Survey, the overall impression one gets is that of a slowing economy. The balance of opinion on sales improved in the current survey to 6.93% from 2.97% in the Fall Survey, but was 8.91 percentage points below the 2005 Winter Survey. Managements, in general, have tended to be less optimistic about future sales since early 2004, as can be seen in the first chart. They have, however, continued to invest in machinery and equipment and to take on employees, as seen in the second chart. However, although the Winter Survey showed an almost 5 percentage points increase in the percent balance expecting to increase investment spending to 19.80%, this level is significantly lower than the 34.65% and 26.73% shown in the first and second quarters of the year.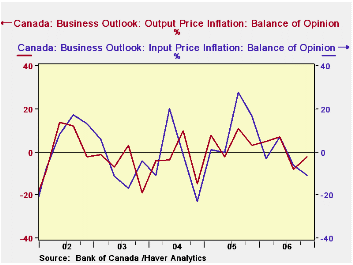
The balance of opinion on input and output price inflation is the difference between expectations of an acceleration and a deceleration of prices. The Fall Survey showed that managements were beginning to see a deceleration in both input and output prices. The current survey shows that the balance of opinion on input prices is -10.89% and that of output prices, -1.95%. (See the third chart)
Managements are seeing some increase in the difficulty of meeting demand, but there has been a slight decline in the balance of those who expect "significant" difficulty as shown in the table below.
| BANK OF CANADA OUTLOOK SURVEY (% Balance) | Q4 06 | Q3 06 | Q5 05 | Q/Q Dif | Y/Y Dif | 2006 | 2005 | 2004 |
|---|---|---|---|---|---|---|---|---|
| Sales | 6.93 | 2.97 | 15.84 | 3.96 | -8.91 | 4.18 | 17.43 | 17.91 |
| Investment in Machinery and Equipment | 19.80 | 14.95 | 19.00 | 4.95 | 0.80 | 24.01 | 19.20 | 16.95 |
| Employment Level | 39.60 | 40.59 | 49.50 | -0.99 | -9.90 | 39.35 | 42.75 | 33.42 |
| Input Price Inflation | -10.89 | -5.94 | 16.83 | -4.95 | -27.72 | -3.22 | 11.39 | -3.54 |
| Output Price Inflation | -1.95 | -7.92 | 2.97 | 5.94 | -4.95 | 0.49 | 4.96 | -3.19 |
| Ability to Meet Demand | ||||||||
| Some Difficulty | 35.60 | 31.70 | 34.70 | 3.90 | 0.90 | 33.43 | 32.58 | 34.00 |
| Significant Difficulty | 13.90 | 14.90 | 14.90 | -1.00 | -1.00 | 13.65 | 11.20 | 7.25 |

Tom Moeller
AuthorMore in Author Profile »Prior to joining Haver Analytics in 2000, Mr. Moeller worked as the Economist at Chancellor Capital Management from 1985 to 1999. There, he developed comprehensive economic forecasts and interpreted economic data for equity and fixed income portfolio managers. Also at Chancellor, Mr. Moeller worked as an equity analyst and was responsible for researching and rating companies in the economically sensitive automobile and housing industries for investment in Chancellor’s equity portfolio. Prior to joining Chancellor, Mr. Moeller was an Economist at Citibank from 1979 to 1984. He also analyzed pricing behavior in the metals industry for the Council on Wage and Price Stability in Washington, D.C. In 1999, Mr. Moeller received the award for most accurate forecast from the Forecasters' Club of New York. From 1990 to 1992 he was President of the New York Association for Business Economists. Mr. Moeller earned an M.B.A. in Finance from Fordham University, where he graduated in 1987. He holds a Bachelor of Arts in Economics from George Washington University.
More Economy in Brief


