Global| Oct 16 2009
U.S. Factory Production Climbs ForThird Month While Plant Utilization Reaches Seven-Month High
by:Tom Moeller
|in:Economy in Brief
Summary
Industrial production is hardly overheating, but the nation's industrial plant is starting to hum again. Output rose a surprising 0.7% during September after gains of 1.2% and 0.8% during the prior two months. An uptick of a meager [...]
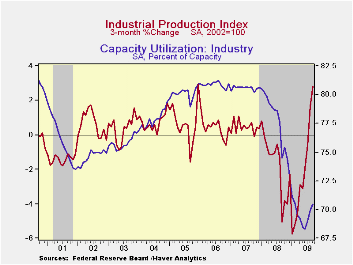
Industrial production is hardly overheating, but the nation's
industrial plant is starting to hum again. Output rose a surprising
0.7% during September after gains of 1.2% and 0.8% during the prior two
months. An uptick of a meager 0.1% had been the Consensus expectation,
based on the decline in factory sector employment last month. 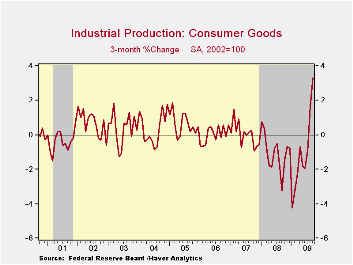 The
productivity of those still working thus soared. The recent output
recovery follows a decline of 14.5% during the 21 months of recession
beginning in January of 2008.
The
productivity of those still working thus soared. The recent output
recovery follows a decline of 14.5% during the 21 months of recession
beginning in January of 2008.
Output of consumer goods rose a firm 1.1% for the third month
of increase following a 10.1% drop during the recession. Production of
autos led the increase with a 7.3% rise, after two months of decline
and a recession loss of 38.5%. Furniture & appliance output
rose a lesser 0.3% which was the second in the last three months.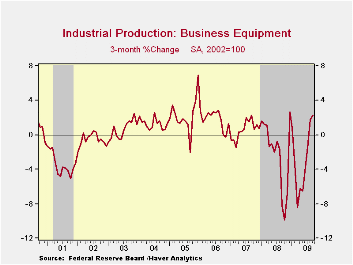 Working the other way, the output of computers, video & audio
equipment showed no sign of recovery, posting a 1.4% (-16.5% y/y)
decline. Outside of the auto and high-tech sectors output ticked 0.3%
higher (-5.3% y/y) during September for the third consecutive monthly
gain. That's against the 12.8% decline during the prior 21 months.
Working the other way, the output of computers, video & audio
equipment showed no sign of recovery, posting a 1.4% (-16.5% y/y)
decline. Outside of the auto and high-tech sectors output ticked 0.3%
higher (-5.3% y/y) during September for the third consecutive monthly
gain. That's against the 12.8% decline during the prior 21 months.
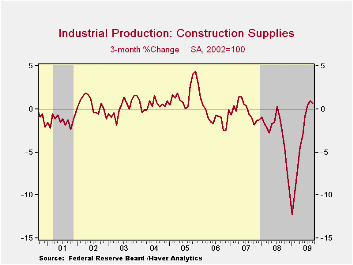
Apparel output rose for third consecutive month of strong gain and the 2.2% increase cut the y/y decline to 11.4%. The output of business equipment rose 0.2% (-8.0% y/y) but the output of construction supplies continued 0.4% (-16.8% y/y) lower after four months of relative stability. Construction supplies output fell 23.4% during this recession.
 Excess industrial capacity diminished during September for the
third consecutive month. In the factory sector alone, the rise to 67.5%
also was the third consecutive monthly gain but it nevertheless left
the figure near its lowest of the postwar period. Across industries,
utilization remained the smallest since WWII.
Excess industrial capacity diminished during September for the
third consecutive month. In the factory sector alone, the rise to 67.5%
also was the third consecutive monthly gain but it nevertheless left
the figure near its lowest of the postwar period. Across industries,
utilization remained the smallest since WWII.
The industrial production data are available in Haver's USECON database.
| INDUSTRIAL PRODUCTION (SA, %) | September | August | Y/Y | 2008 | 2007 | 2006 |
|---|---|---|---|---|---|---|
| Total Output | 0.7 | 1.2 | -6.0 | -2.2 | 1.5 | 2.3 |
| Manufacturing | 0.8 | 1.2 | -7.8 | -3.2 | 1.4 | 2.5 |
| Consumer Goods | 1.1 | 1.5 | -1.8 | -2.6 | 0.9 | 0.4 |
| Business Equipment | 0.2 | 1.1 | -8.0 | -1.1 | 2.7 | 9.4 |
| Construction Supplies | -0.4 | 0.5 | -16.8 | -6.3 | -2.0 | 2.3 |
| Utilities | -0.7 | 1.9 | -2.1 | 0.3 | 3.4 | -0.6 |
| Capacity Utilization | 70.5 | 69.9 | 74.5 (Sept. '08) | 77.5 | 80.6 | 80.9 |
by Tom Moeller October 16, 2009
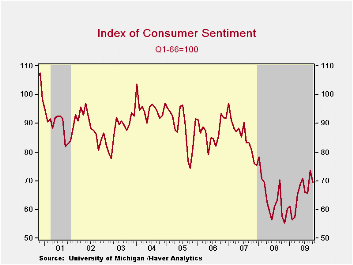 Consumer
sentiment sagged this month but retraced just half of the rise during
September. The University of Michigan's mid-month October reading of
consumer sentiment fell to 69.4 from a September reading of 73.5.
Despite the decline sentiment remained up by roughly one-quarter from
the low last Fall. Consensus expectations had been for no change this
month versus September. During the last ten years, there has been a 69%
correlation between the level of sentiment and the growth in real
consumer spending during the next five months.
Consumer
sentiment sagged this month but retraced just half of the rise during
September. The University of Michigan's mid-month October reading of
consumer sentiment fell to 69.4 from a September reading of 73.5.
Despite the decline sentiment remained up by roughly one-quarter from
the low last Fall. Consensus expectations had been for no change this
month versus September. During the last ten years, there has been a 69%
correlation between the level of sentiment and the growth in real
consumer spending during the next five months.
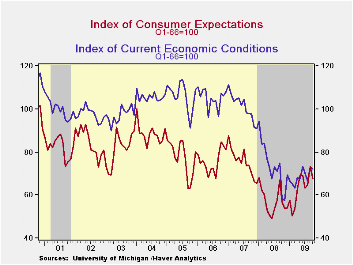 The
latest decline was led by a sharp 18.7% drop in expected business
conditions during the next five years which reversed much of the recent
improvement. Expected conditions during the next year fell just
modestly and the index remained more than double the February low.
Conversely, the expected change in personal finances improved and the
index was up nearly one-quarter from the low during 2008 with the
higher stock market.
The reading of current economic condition fell
just moderately as the reading of personal finances slipped m/m. It has
remained range-bound this year with higher unemployment. The reading of
buying conditions for large household goods held steady m/m but it is
up by one-third from the November low due to low prices.
Expected
price inflation during the next year amounted to 3.1%; up slightly from
September but down from a high of 7% during May of last year. A low of
0.3% inflation was expected by 25% of respondents but 5.0% inflation
was expected by another quarter. Inflation of 3.4% during the next 5-10
years was the mean expectation.
The opinion of
government policy, which may eventually influence economic
expectations, fell slightly from September and remained near
the lowest level since February.
The
latest decline was led by a sharp 18.7% drop in expected business
conditions during the next five years which reversed much of the recent
improvement. Expected conditions during the next year fell just
modestly and the index remained more than double the February low.
Conversely, the expected change in personal finances improved and the
index was up nearly one-quarter from the low during 2008 with the
higher stock market.
The reading of current economic condition fell
just moderately as the reading of personal finances slipped m/m. It has
remained range-bound this year with higher unemployment. The reading of
buying conditions for large household goods held steady m/m but it is
up by one-third from the November low due to low prices.
Expected
price inflation during the next year amounted to 3.1%; up slightly from
September but down from a high of 7% during May of last year. A low of
0.3% inflation was expected by 25% of respondents but 5.0% inflation
was expected by another quarter. Inflation of 3.4% during the next 5-10
years was the mean expectation.
The opinion of
government policy, which may eventually influence economic
expectations, fell slightly from September and remained near
the lowest level since February.  Thirty percent of
respondents thought that a poor job was being done by government. A
reduced 19% thought that a good job was being done. It had hit 30% in
April.
The University of Michigan survey data is not seasonally
adjusted. The reading is based on telephone interviews with about 500
households at month-end; the mid-month results are based on about 300
interviews. The summary indexes are in Haver's USECON database
with details in the proprietary UMSCA database.
Optimism
Amid Uncertainty from the Federal Reserve Bank of Dallas is
available
here.
Thirty percent of
respondents thought that a poor job was being done by government. A
reduced 19% thought that a good job was being done. It had hit 30% in
April.
The University of Michigan survey data is not seasonally
adjusted. The reading is based on telephone interviews with about 500
households at month-end; the mid-month results are based on about 300
interviews. The summary indexes are in Haver's USECON database
with details in the proprietary UMSCA database.
Optimism
Amid Uncertainty from the Federal Reserve Bank of Dallas is
available
here.
| University of Michigan | Mid-October | September | August | Oct y/y | 2008 | 2007 | 2006 |
|---|---|---|---|---|---|---|---|
| Consumer Sentiment | 69.4 | 73.5 | 65.7 | 20.5% | 63.8 | 85.6 | 87.3 |
| Current Conditions | 72.1 | 73.4 | 66.6 | 23.5 | 73.7 | 101.2 | 105.1 |
| Expectations | 67.6 | 73.5 | 65.0 | 18.6 | 57.3 | 75.6 | 75.9 |
by Robert Brusca October 16, 2009
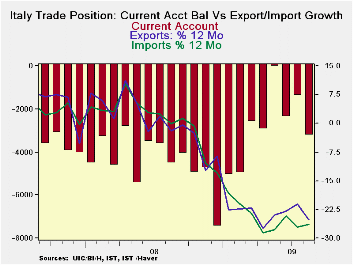
Italy’s exports and imports both dropped on the month with
exports dropping faster. As a result, the trade gap widened. But the
gap has improved from its worst level at end of 2008. True, the deficit
has expanded again from it best level in May of 2009, but both exports
and imports are on the mend. The export drop this month was
particularly large and therefore it is hard to put in context; it will
take several more months to figure out if this is a new trend of sorts,
or an oddity.
One problem is that Germany, too, had reported a sharp and
unexpected drop in exports. So the Italian drop may have something to
it. Even so it could be that the same rogue factor affected both of
them, it could be a coincidence, or it could be a fundamental weakening
in exports. It will take time to tell
Because of the relatively sharp drop this month, -15.9% for
exports Vs -8.8% for imports, the Yr/Yr trends are probably distorted.
But both export and import growth are down sharply across major
category components (see the table, at the bottom).
While all nations are banking on trade to become an engine of
growth, US demand seems to be slow in starting and most industrialized
economies are having a hard time getting into gear, too. It is in this
environment in which it is hard to see why up to this point exports
have responded so well in the cycle. One man’s export is another’s
import and ultimately is linked to domestic demand which remains
globally challenged: that is the part that is hard to figure out. Whose
export demands have been strong and will they stay that way?
| Italy's Trade Trends | |||||||
|---|---|---|---|---|---|---|---|
| m/mo % monthly rate | Period Specified saar | ||||||
| Seasonally Adjusted | Aug-09 | Jul-09 | Jun-09 | 3-MO | 6-Mo | 12-Mo | Yr-Ago |
| Current Account Bal | €€(3,237) | €€(1,382) | €€(2,378) | €€(2,332) | €€(2,099) | €€(3,656) | €€(3,927) |
| Goods Balance | €€(1,086) | €€814 | €€939 | €€222 | €€592 | €€163 | €€86 |
| Exports | -15.9% | 11.8% | -1.3% | -25.7% | -22.4% | -24.4% | -8.9% |
| Imports | -8.8% | 12.9% | 1.2% | 17.9% | -10.9% | -26.0% | -2.4% |
| Services Balance | €€ 352 | €€ (399) | €€ (788) | €€ (278) | €€ (585) | €€ (766) | €€ (458) |
| Exports | 10.4% | 5.8% | -0.4% | 83.3% | 41.6% | -0.7% | -2.9% |
| Imports | -1.7% | -0.8% | 3.3% | 3.0% | -15.6% | -12.1% | -3.3% |
| Not Seasonally Adjusted | All Yr/Yr | ||||||
| Exports | Aug-09 | Aug-08 | Aug-07 | Aug-06 | |||
| Food&Bev | -1.7% | -1.7% | 7.2% | 10.1% | |||
| Capital Gds | -24.9% | -8.2% | 15.9% | 12.5% | |||
| Transport | -23.9% | -7.9% | 9.0% | 14.9% | |||
| Consumer Gds | -14.1% | -11.5% | 8.0% | 8.3% | |||
| Other Gds | -44.2% | 4.3% | 4.5% | 20.0% | |||
| Imports | Aug-09 | Aug-08 | Aug-07 | Aug-06 | |||
| Food&Bev | -10.5% | -0.5% | 6.4% | 6.9% | |||
| Capital Gds | -22.4% | -10.5% | 13.1% | 6.0% | |||
| Transport | -21.9% | -6.2% | 11.6% | 5.6% | |||
| Consumer Gds | -8.5% | -5.7% | 8.3% | 9.1% | |||
| Other Gds | -42.6% | 9.7% | -0.1% | 33.4% | |||
| Balances in Mlns of euros | |||||||

Tom Moeller
AuthorMore in Author Profile »Prior to joining Haver Analytics in 2000, Mr. Moeller worked as the Economist at Chancellor Capital Management from 1985 to 1999. There, he developed comprehensive economic forecasts and interpreted economic data for equity and fixed income portfolio managers. Also at Chancellor, Mr. Moeller worked as an equity analyst and was responsible for researching and rating companies in the economically sensitive automobile and housing industries for investment in Chancellor’s equity portfolio. Prior to joining Chancellor, Mr. Moeller was an Economist at Citibank from 1979 to 1984. He also analyzed pricing behavior in the metals industry for the Council on Wage and Price Stability in Washington, D.C. In 1999, Mr. Moeller received the award for most accurate forecast from the Forecasters' Club of New York. From 1990 to 1992 he was President of the New York Association for Business Economists. Mr. Moeller earned an M.B.A. in Finance from Fordham University, where he graduated in 1987. He holds a Bachelor of Arts in Economics from George Washington University.
More Economy in Brief