 Global| Jun 03 2008
U.S. Factory Inventories Slipped in April
by:Tom Moeller
|in:Economy in Brief
Summary
Factory inventories slipped slightly during April after increases near 1.0% during the prior several months. The three-month growth rate, as a result, eased to 6.2% which was half the recent rates of growth. Inventories of nondefense [...]
Factory inventories slipped slightly during April after increases near 1.0% during the prior several months. The three-month growth rate, as a result, eased to 6.2% which was half the recent rates of growth.
Inventories of nondefense aircraft and light trucks posted strong increases over the last three months of 14.1% and 31.1%, respectively. Automobile inventories, conversely, are down at a 47.7% rate. Less the transportation sector altogether inventories fell 0.2% in April and three-month growth totaled 4.6%.
Inventory accumulation in the machinery sector was firm at
9.0% over the last three months after a 5.4% 2007 increase while the
rate of accumulation in the computer area surged to 10.7% after slight
decumulation last year. Working the other way, nondurable inventories
fell 1.0% during April and three-month growth eased to 2.8% after
double digit growth rates earlier this year. Petroleum inventories fell
6.4% in April and that pulled three-month negative after double digit
growth last year.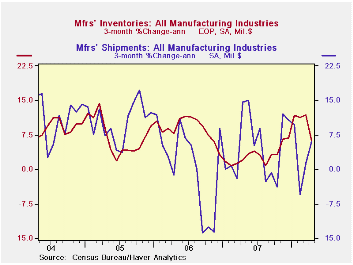
Factory shipments surged 2.2% during April, double the March jump. Higher prices lifted shipments of petroleum by 6.3% after a 10.7% March jump. Less petroleum shipments still surged by 1.6% following declines during the prior several months. Shipments of textiles and apparel have been falling hard but machinery shipments rose at an 8.7% rate during the last three months. Computer shipments and of electrical equipment & appliances also have fallen.
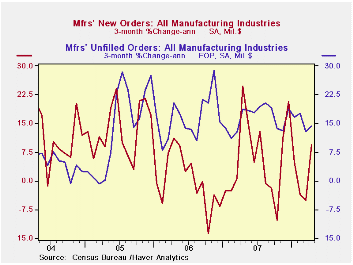
Total factory orders rose another firm 1.1% although that reflected the 6.3% jump in petroleum orders (which equal shipments). Less petroleum, shipments rose 0.4% and three- month growth picked up to 2.8%. Durable orders overall fell 0.6% which was little different than reported in the advance report.
Overall unfilled orders rose 0.9% in April and the three-month growth rate remained firm at 14.4%. Much of that strength has been due to higher backlogs of civilian aircraft which have been rising at a 28.3% rate. Excluding the transportation sector altogether unfilled orders still rose 1.5% in April. Accelerated growth in backlogs of machinery and electrical equipment accounts for that strength.
| Factory Survey (NAICS, %) | April | March | Y/Y | 2007 | 2006 | 2005 |
|---|---|---|---|---|---|---|
| Inventories | -0.0 | 0.9 | 6.0 | 3.7 | 6.4 | 8.9 |
| Excluding Transportation | -0.2 | 0.8 | 5.0 | 2.7 | 7.9 | 8.1 |
| New Orders | 1.1 | 1.5 | 3.8 | 1.9 | 6.2 | 11.9 |
| Excluding Transportation | 2.6 | 2.6 | 7.9 | 1.2 | 7.4 | 11.7 |
| Shipments | 2.2 | 1.1 | 5.0 | 1.2 | 5.9 | 10.4 |
| Excluding Transportation | 2.3 | 1.9 | 6.7 | 1.5 | 6.7 | 11.4 |
| Unfilled Orders | 0.9 | 1.3 | 16.0 | 17.1 | 15.3 | 15.4 |
| Excluding Transportation | 1.5 | 0.8 | 9.0 | 8.2 | 16.0 | 9.2 |
by Tom Moeller June 3, 2008
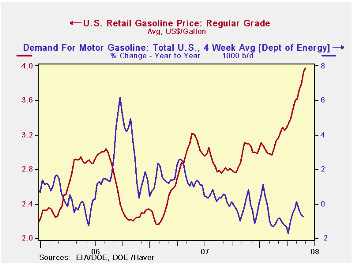
The retail price for a gallon of regular gasoline rose another four cents last week to $3.98 per gallon, according to the U.S. Department of Energy survey. The rise followed the previous week's fifteen cent increase and it raised gasoline prices by nearly one-third just since yearend '07.
Yesterday, the spot market price for a gallon of regular gasoline rose to $3.27, up another three cents from last week's average.
Weekly gasoline prices can be found in Haver's WEEKLY database, daily prices are in the DAILY database.
According to the U.S. Department of Energy the increase in
gasoline prices, along with the slowdown in economic growth, have
lowered the demand for gasoline during the latest four weeks by 0.7%
from a year earlier. Refinery production of gasoline is down roughly
1.0% during that period. 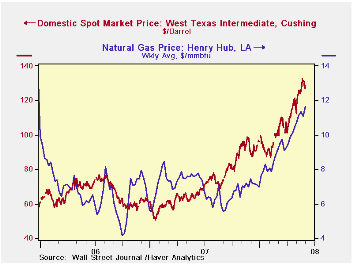
The DOE figures are available in Haver's OILWKLY database.
During all of last week, the price of a barrel of WTI crude oil slipped w/w to an average of $128.47. Yesterday the price slipped further to $127.76.
Natural gas prices rose to the highest level since late 2005. At $11.669/mmbtu, last week's average price was up 52.9% versus a year earlier and it was at its highest level since December of 2005.
This morning's remarks by Fed Chairman Ben S. Bernanke on the economic outlook are available here.
| Weekly Prices | 06/02/08 | 05/26/08 | Y/Y | 2007 | 2006 | 2005 |
|---|---|---|---|---|---|---|
| Retail Regular Gasoline ($ per Gallon) | 3.98 | 3.94 | 25.9% | 2.80 | 2.57 | 2.27 |
| Light Sweet Crude Oil, WTI ($ per bbl.) | 128.47 | 130.15 | 100.9% | 72.25 | 66.12 | 56.60 |
by Tom Moeller June 3, 2008
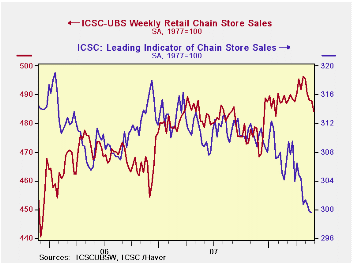
The International Council of Shopping Centers reported that chain store sales slid 0.8% last week from the week earlier.
The latest weekly sales decline pulled the total during all of May down 0.9% from April; during which sales rose 1.0%.
During the last ten years there has been a 45% correlation between the y/y change in chain store sales and the change in nonauto retail sales less gasoline.
The ICSC-UBS retail chain-store sales index is constructed using the same-store sales (stores open for one year) reported by 78 stores of seven retailers: Dayton Hudson, Federated, Kmart, May, J.C. Penney, Sears and Wal-Mart.
During the latest week, the leading indicator of chain store sales from ICSC-UBS was unchanged week-to-week and was down 3.0% from one year earlier.
The chain store sales figures are available in Haver's SURVEYW database.
| ICSC-UBS (SA, 1977=100) | 05/31/08 | 05/24/08 | Y/Y | 2007 | 2006 | 2005 |
|---|---|---|---|---|---|---|
| Total Weekly Chain Store Sales | 484.3 | 488.2 | 1.2% | 2.8% | 3.3% | 3.6% |
by Robert BruscaJune 3, 2008
GDP growth was revised up from a quarterly gain of 0.7% to a
gain of 0.8% in 2008-Q1. Still, Yr/Yr growth is tailing off to its
lowest pace since end 2005. Myriad domestic indicators and surveys
point to further slowing ahead. Private consumption growth has steeped
down to just over 1%. Last quarter public consumption stepped down too-
but it’s too soon to call that a trend. Capital spending spurted
quarter-to-quarter but has slowed a bit Yr/Yr. Surveys on this have
been mixed. Net exports are less of a driver of growth, as imports have
picked up and export growth now roughly paces with them. Domestic
demand shows signs of slowing. This is clearly the result of damped
consumption and step back of uncertain duration in government spending
and mixed trends for investment spending.
| European GDP EU-15 | ||||||||||
|---|---|---|---|---|---|---|---|---|---|---|
| Consumption | Capital Formation | Trade Domestic | ||||||||
| GDP | Private | Public | Total | X Housing |
Housing | X-M: Bil E |
Exports | Imports | Demand | |
| % change Q/Q; X-M is Q/Q change in Blns of euros | ||||||||||
| Q1-08 | 3.2% | 0.6% | 1.5% | 11.0% | #N/A | #N/A | 1.0 | 7.8% | 7.6% | 3.1% |
| Q4-07 | 1.3% | -0.2% | -0.1% | 2.0% | 3.6% | -2.6% | 4.9 | 1.2% | -1.1% | 0.3% |
| Q3-07 | 2.7% | 1.8% | 3.3% | 5.1% | 5.8% | 3.1% | -0.7 | 9.3% | 9.9% | 2.8% |
| Q2-07 | 1.5% | 2.5% | 1.1% | -5.4% | -5.5% | -4.9% | 5.6 | 3.7% | 1.0% | 0.4% |
| % change Yr/Yr; X-M is Yr/Yr change in Gap in Blns of euros | ||||||||||
| Q1-08 | 2.2% | 1.2% | 1.4% | 3.0% | #N/A | #N/A | 10.9 | 5.4% | 4.3% | 1.6% |
| Q4-07 | 2.1% | 1.2% | 2.0% | 3.9% | 5.2% | 0.1% | 4.4 | 4.4% | 4.0% | 2.0% |
| Q3-07 | 2.7% | 1.8% | 2.6% | 2.9% | 3.3% | 1.7% | 9.9 | 7.2% | 6.1% | 2.2% |
| Q2-07 | 2.6% | 1.8% | 2.4% | 3.4% | 3.8% | 2.0% | 6.6 | 5.9% | 5.2% | 2.3% |
| 5-Yrs | 2.2% | 1.6% | 1.8% | 3.6% | #N/A | #N/A | #N/A | 6.0% | 5.7% | 2.0% |
by Louise Curley June 3, 2008
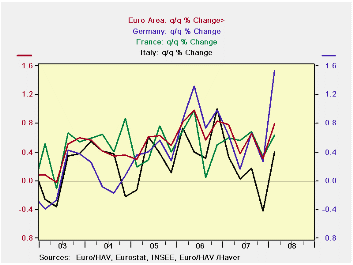
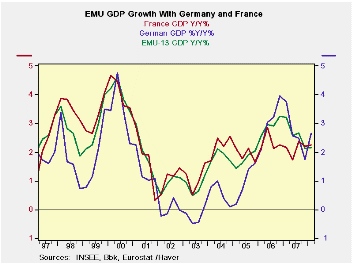
Revised figures for growth in Gross Domestic Product in the Euro Area in the first quarter of this year, published today, were better than the flash estimates reported earlier--an increase of 0.8% instead of 0.7%. Growth in Germany was 1.5%, in part the result of unusually high activity in the construction field due to mild winter weather. The quarterly rates of growth in Germany, France, Italy and the entire Euro Area are shown in the first chart. Germany's performance is a clear stand out.
The performance of the area and of Germany in particular was in stark contrast to that of the United States, where real GDP increased at an annual rate of 0.22% in the first quarter of 2008. At annual rates, the Euro Area grew 3.2% and Germany grew 6.3%.
Most forecasters expect growth in the Euro Area and in Germany to slow in the remaining quarters of 2008, but some have begun to raise their forecasts for the whole year as a result of the strong first quarter. The IMF has recently raised its 2008 forecast for the Euro Area from 1.4 % to 1.75%
| REAL GDP (Billions of Chained 2000Euros) | Q1 08 | Q4 07 | Q1 07 | Q/Q % | Y/Y % | 2007% | 2006% | 2005% |
|---|---|---|---|---|---|---|---|---|
| Euro Area | 1946.9 | 1931.5 | 1905.8 | 0.80 | 2.16 | 2.65 | 2.92 | 1.75 |
| Germany | 572.1 | 563.5 | 557.4 | 1.53 | 2.64 | 2.62 | 3.08 | 0.97 |
| France | 414.1 | 411.5 | 405.0 | 0.64 | 2.25 | 2.11 | 2.36 | 1.92 |
| Italy | 321.8 | 320.5 | 321.2 | 0.41 | 0.18 | 1.36 | 1.90 | 0.68 |

Tom Moeller
AuthorMore in Author Profile »Prior to joining Haver Analytics in 2000, Mr. Moeller worked as the Economist at Chancellor Capital Management from 1985 to 1999. There, he developed comprehensive economic forecasts and interpreted economic data for equity and fixed income portfolio managers. Also at Chancellor, Mr. Moeller worked as an equity analyst and was responsible for researching and rating companies in the economically sensitive automobile and housing industries for investment in Chancellor’s equity portfolio. Prior to joining Chancellor, Mr. Moeller was an Economist at Citibank from 1979 to 1984. He also analyzed pricing behavior in the metals industry for the Council on Wage and Price Stability in Washington, D.C. In 1999, Mr. Moeller received the award for most accurate forecast from the Forecasters' Club of New York. From 1990 to 1992 he was President of the New York Association for Business Economists. Mr. Moeller earned an M.B.A. in Finance from Fordham University, where he graduated in 1987. He holds a Bachelor of Arts in Economics from George Washington University.
More Economy in Brief


