 Global| Jul 02 2008
U.S. Factory Inventories Rose With Shipments
by:Tom Moeller
|in:Economy in Brief
Summary
Factory inventories increased 0.5% in May after little change during the prior month. As a result of recent moderation, the three-month growth rate eased further to 5.9% (AR), which was half the growth rates of this past Winter. The [...]
Factory inventories increased 0.5% in May after little change during the prior month. As a result of recent moderation, the three-month growth rate eased further to 5.9% (AR), which was half the growth rates of this past Winter.
The picture of more moderate rates of inventory accumulation was widespread. Automobile inventories, in fact, fell at a 34.3% rate during the last three months. Less the transportation sector altogether, inventories rose 0.5% in May but three-month growth fell to 4.4% from a double-digit rate of accumulation earlier this year.
Inventory accumulation in the machinery sector also eased to a 5.2% growth rate, which was half the earlier rate. Accumulation in the computer & electronics areas also eased, but just slightly to an 8.4% rate of growth. In the nondurables area inventories rose 0.6% in May but three-month growth of 2.4% was down considerably versus the double digit growth rate earlier this year.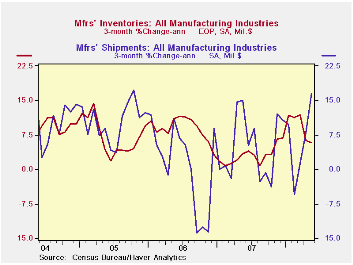
Factory shipments nudged up 0.1% after to 2.7% March surge. Shipments of petroleum surged again, in May by 4.0% (39.0% y/y). Less petroleum shipments fell 0.6% (+0.4% y/y). Growth of 5-7% had been the norm back from 2004-2006.
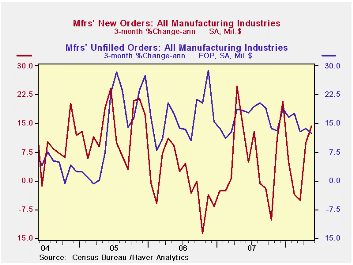
Total factory orders rose an expected 0.6% again reflecting stronger petroleum orders (which equal shipments). Less petroleum, shipments rose 0.1% and three-month growth was a moderate 2.6% (AR). Durable orders overall were unchanged, which was little different than reported in the advance report, after a 1.0% April decline.
Overall unfilled orders rose 0.9% in May and the three-month growth rate remained firm at 12.3%. Higher backlogs of civilian aircraft, which have been rising at a 25.3% rate, boosted the figure. Excluding the transportation sector altogether unfilled orders still rose 0.5% in May and at a 10.1% rate during the last three months. Accelerated growth in backlogs of machinery still account for much of that strength.
Why Are Goods So Cheap in Some Countries? from the Federal Reserve Bank of Philadelphia is available here.
| Factory Survey (NAICS, %) | May | April | Y/Y | 2007 | 2006 | 2005 |
|---|---|---|---|---|---|---|
| Inventories | 0.5 | -0.0 | 6.1 | 3.7 | 6.4 | 8.9 |
| Excluding Transportation | 0.5 | -0.2 | 5.0 | 2.7 | 7.9 | 8.1 |
| New Orders | 0.6 | 1.3 | 5.0 | 1.9 | 6.2 | 11.9 |
| Excluding Transportation | 0.4 | 2.8 | 7.4 | 1.2 | 7.4 | 11.7 |
| Shipments | 0.1 | 2.7 | 4.7 | 1.2 | 5.9 | 10.4 |
| Excluding Transportation | 0.6 | 2.9 | 7.2 | 1.5 | 6.7 | 11.4 |
| Unfilled Orders | 0.9 | 0.7 | 15.8 | 17.1 | 15.3 | 15.4 |
| Excluding Transportation | 0.5 | 1.1 | 8.5 | 8.2 | 16.0 | 9.2 |

Tom Moeller
AuthorMore in Author Profile »Prior to joining Haver Analytics in 2000, Mr. Moeller worked as the Economist at Chancellor Capital Management from 1985 to 1999. There, he developed comprehensive economic forecasts and interpreted economic data for equity and fixed income portfolio managers. Also at Chancellor, Mr. Moeller worked as an equity analyst and was responsible for researching and rating companies in the economically sensitive automobile and housing industries for investment in Chancellor’s equity portfolio. Prior to joining Chancellor, Mr. Moeller was an Economist at Citibank from 1979 to 1984. He also analyzed pricing behavior in the metals industry for the Council on Wage and Price Stability in Washington, D.C. In 1999, Mr. Moeller received the award for most accurate forecast from the Forecasters' Club of New York. From 1990 to 1992 he was President of the New York Association for Business Economists. Mr. Moeller earned an M.B.A. in Finance from Fordham University, where he graduated in 1987. He holds a Bachelor of Arts in Economics from George Washington University.
More Economy in Brief


