Global| Apr 12 2007
U.S. Export and Import Prices: No Excitement but Uneven Trends
Summary
UK trade data came out today for February, with the goods balance, -£6.8 billion, somewhat larger than the -£6.5 billion expected in at least two forecast surveys. Exports eased very slightly to -£18.4 billion from -£18.5 billion in [...]
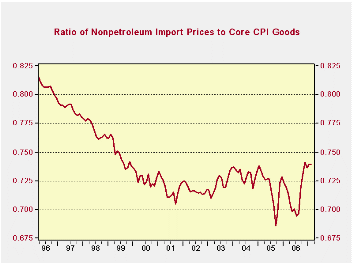
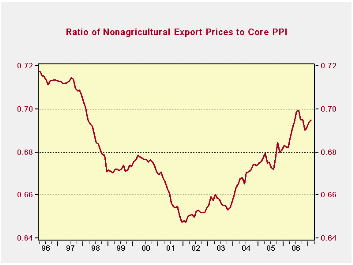
| The small table below is the capsule summary of export and import prices. We prefer to look at nonagricultural export prices and nonpetroleum import prices since these correspond best to the core domestic inflation measures we follow most closely. Nonpetroleum import prices rose by a bit uncomfortable 0.3% in March while nonagricultural export prices rose by a sharp 0.6%. In the month, both the agricultural export and petroleum import prices surged. Still nonpetroleum import prices do NOT show an accelerating inflation trend but nonagricultural export prices do so. |
|---|
| Imports | Exports | ||||||
|---|---|---|---|---|---|---|---|
| SAAR | All | Petrol | Excl Petrol | SAAR | All | Agriculture | Non-Agricultural |
| 3-MO | 2.5% | -8.9% | 1.1% | 3-MO | 7.7% | 24.7% | 6.7% |
| 6-MO | -0.7% | -41.2% | 2.3% | 6-MO | 5.3% | 30.3% | 3.5% |
| Yr/Yr | 2.8% | -5.5% | 2.9% | Yr/Yr | 5.3% | 20.2% | 4.2% |
| 2-Yrs | 3.6% | 14.5% | 1.9% | 2-Yrs | 3.8% | 10.0% | 3.3% |
| MO/MO | 1.7% | 9.0% | 0.3% | MO/MO | 0.7% | 2.1% | 0.6% |
| The more detailed ‘end use’ categories reveal that the inflation that pertains to imported consumer goods in the month was just 0.2% and the trend there is fairly flat. Motor vehicle prices rose by 0.1% and they have a lower trajectory and still flat trend as well. Imported capital goods prices have fallen for two months in a row and trends there are working lower. Food prices are up, explaining some of the strength in nonoil import prices. Export prices are quite strong even excluding foods/agricultural products. Nonagricultural export prices are up by 4.2% yr/yr and by 6.7% over three months (SAAR). Some of this is industrial supplies and materials where oil prices reside and the US does have some oil exports. But food prices and industrial supplies show the bulk of the pricing pressure on sales abroad. Capital goods prices are weak, as they are for imports, but trends are a bit firmer for export prices. |
|---|
| M/MO | SAAR | |||||
| IMPORTS | Mar-07 | Feb-07 | Jan-07 | 3-MO | 6-MO | 12-MO |
| ALL Imports | 1.7% | 0.1% | -1.1% | 2.5% | -0.7% | 2.8% |
| Excl Petrol | 0.3% | 0.1% | -0.1% | 1.1% | 2.3% | 2.9% |
| Petrol | 9.0% | 0.6% | -6.6% | 10.2% | -11.8% | 2.4% |
| Foods Feeds and Beverages | -0.1% | 0.2% | 1.5% | 6.7% | 6.2% | 6.5% |
| Industrial Supplies | 5.0% | 0.4% | -3.7% | 6.1% | -3.6% | 5.4% |
| Capital Goods | -0.1% | -0.2% | 0.0% | -1.3% | -0.2% | 0.1% |
| Motor Vehicles & Parts | 0.1% | 0.2% | 0.0% | 1.2% | 1.0% | 1.1% |
| Consumer Goods excl Autos | 0.2% | 0.0% | 0.2% | 1.6% | 1.8% | 1.8% |
| M/MO | SAAR | |||||
| EXPORTS | Mar-07 | Feb-07 | Jan-07 | 3-MO | 6-MO | 12-MO |
| ALL Exports | 0.7% | 0.7% | 0.4% | 7.7% | 5.3% | 5.3% |
| Agriculture | 2.1% | 2.8% | 0.7% | 24.7% | 30.3% | 20.2% |
| Non Agricultural | 0.6% | 0.5% | 0.5% | 6.7% | 3.5% | 4.2% |
| Foods Feeds and Beverages | 2.3% | 3.3% | 0.2% | 25.8% | 30.1% | 20.7% |
| Industrial Supplies | 1.9% | 1.9% | 0.6% | 19.0% | 8.9% | 10.9% |
| Capital Goods | 0.0% | -0.1% | 0.3% | 0.8% | 1.0% | 0.8% |
| Motor Vehicles & Parts | 0.1% | 0.1% | 0.2% | 1.5% | 1.3% | 1.4% |
Our approximations of core export and core import prices taken as ratios to core domestic goods prices show that international prices are rising faster than domestic price counterparts, imparting some inflation impulse to the US. For these calculations we use core consumer goods prices to compare to nonoil imports and core PPI prices for nonagricultural exports. It is difficult to get a precise match but these results are suggestive of some upward pressure. |
|---|
  |
In terms of discerning an inflation impact to the domestic price level the final link is the exchange rate. Here we see a collection of currencies. The dollar is weaker since early 2002 to varying degrees against all these currencies. But the dollar’s drop versus the euro has slowed since late 2004 and from that same point the dollar has actually risen versus the yen. The dollars drop versus other Asian currencies has slowed since then as well, except for the yuan, for which the downward creep began in early 2005. On balance a weaker dollar risks importing inflation as the dollar fall causes foreign prices to rise when translated into domestic currency units when they become imports. For example, if the euro rises by 10% all things priced in euros will tend to rise by 10% depending on the sellers pricing policy. Firms that cut euro prices to damp dollar prices also shave profits in order to retain market share. There comes a point where such shaving ceases to makes sense. A weaker dollar also affords US producers an opportunity to hike dollar prices (somewhat) and still improve their competitiveness versus foreign-based sellers abroad. We see some but scant evidence of this in export prices but foods and industrial supplies and materials are seeing the most of the export price increases and these categories are driven by the pricing of commodities where there is often little discretion.  On balance export and import prices are not a great threat to inflation in the US. But at the moment and given currency market trends they appear to be at least a slight impediment to price stability. On balance export and import prices are not a great threat to inflation in the US. But at the moment and given currency market trends they appear to be at least a slight impediment to price stability. |
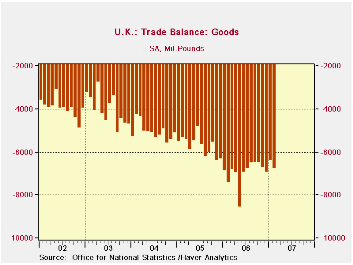
UK trade data came out today for February, with the goods balance, -£6.8 billion, somewhat larger than the -£6.5 billion expected in at least two forecast surveys. Exports eased very slightly to -£18.4 billion from -£18.5 billion in February. Imports edged up to -£25.2 billion from -£24.9 billion.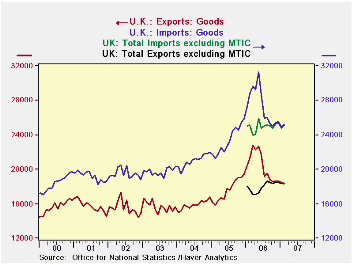
Press reports highlight the recent strengthening of the pound as putting pressure on exports, making it harder for manufacturers to sell their goods abroad. This is perhaps true. They cite evidence from some erosion in the BCC survey, also reported today. Manufacturers' export orders "fell" to a +20% reading in Q1 from +21% in Q4 and +28% in Q3 2006. However, we notice that the BCC number has generally been lower than this and in fact has not been as high since 1996 (see graph 3).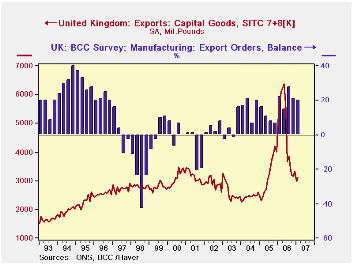
Similarly, the value of exports is "low" only in relation to the inflated figures for the spring of last year. Last time we wrote on UK trade, on November 9, we discussed in detail the artificiality built into the UK trade data by widespread VAT fraud, known by the acronym "MTIC". As seen in the table below and in graph 2, this practice has been sharply curtailed. Absent its effect, exports have been essentially flat since last summer and comfortably above any prior period.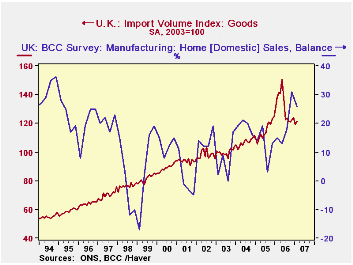
The same pattern holds for imports. Adjusted to remove the MTIC, they too have been steady for several months. We'd like to say the strong pound has something to do with this, and perhaps it does. There's also a strong correlation between imports of consumer goods and UK retail trade. The BCC data show a dip for Q1 in manufacturers' "home" orders, that is, for domestic customers, but these too have run stronger in the last two quarters than anytime since the mid-1990s.
So possibly, a strong currency is pulling down on the UK economy, but available data seem inconclusive in establishing this at present. These trade figures and business activity seem instead to indicate sustained, firm trends in UK activity.
| UK Trade in Goods (SA, Mil.£) | Feb 2007 | Jan 2007 | Year Ago | Monthly Averages|||
|---|---|---|---|---|---|---|
| 2006 | 2005 | 2004 | ||||
| Trade Balance | -6791 | -6402 | -7432 | -6974 | -5732 | -5074 |
| Exports | 18407 | 18497 | 21306 | 20379 | 17635 | 15906 |
| Capital Goods | 3104 | 2993 | 5729 | 4637 | 3178 | 2453 |
| Oil (SITC 33) | 1542 | 1559 | 1757 | 1927 | 1650 | 1350 |
| Imports | 25198 | 24899 | 28738 | 27353 | 23367 | 20981 |
| Capital Goods | 3554 | 3559 | 7122 | 5826 | 4103 | 3352 |
| Oil (SITC 33) | 1710 | 1978 | 1958 | 2235 | 1832 | 1276 |
| Balance less MTIC | -6800 | -6300 | -7400 | -6975 | -- | -- |
| Exports less MTIC | 18300 | 18500 | 17700 | 17983 | -- | -- |
| Imports less MTIC | 25100 | 24800 | 25100 | 24958 | -- | -- |
| BCC Survey | Q1 2007 | Q4 2006 | Q1 2006 | |||
| Home Orders | 23 | 27 | 13 | 18 | 7 | 14 |
| Export Orders | 20 | 21 | 22 | 22 | 11 | 16 |
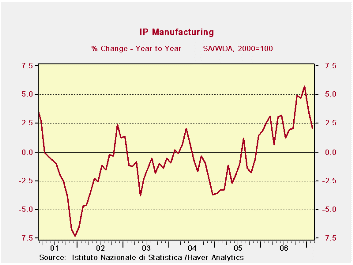 Italy is one of the larger, but not one of the leading EMU economies. Still its performance in the industrial side is fading after a strong run that had begun to look like it was a sustained recovery (see chart below). Across the various sectors output is mostly falling in February. Transportation is a notable exception. Sequential growth rates by sector (table above) show growth fading across most sectors as well with capital goods as and exception along with transportation- still it’s not enough to bolster the overall index of output that has dropped by two percentage points in two month’s time. Italy is one of the larger, but not one of the leading EMU economies. Still its performance in the industrial side is fading after a strong run that had begun to look like it was a sustained recovery (see chart below). Across the various sectors output is mostly falling in February. Transportation is a notable exception. Sequential growth rates by sector (table above) show growth fading across most sectors as well with capital goods as and exception along with transportation- still it’s not enough to bolster the overall index of output that has dropped by two percentage points in two month’s time.Italy’s industrial sector had hit a sort of bottom in early 2005 and since then recovery has been largely underway. In late 2006 Italy’s output took a couple of very sharp moves to the upside and from that base it is now faltering with two sharp monthly declines that have reduced Yr/Yr real output growth from 6% to 2%. All this has put the uptrend in jeopardy. |
| SAAR except m/m | Feb-07 | Jan-07 | Dec-06 | 3-mo | 6-mo | 12-mo |
| IP-Manufacturing | -0.4% | -1.6% | 1.6% | -1.6% | -0.2% | 2.1% |
| Consumer | -2.1% | -2.4% | 2.6% | -7.7% | -5.3% | -2.4% |
| Capital Goods | 0.2% | -2.3% | 4.0% | 7.5% | 2.8% | 3.6% |
| Intermediate | -0.7% | -1.8% | 0.7% | -7.1% | -1.8% | 1.1% |
| Memo | ||||||
| Transportation | 3.4% | -5.0% | 4.2% | 9.7% | -12.0% | 1.2% |
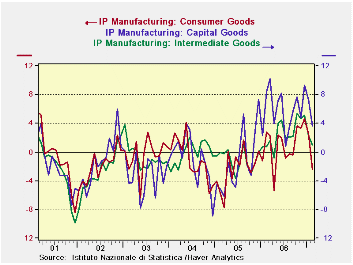 Graphically Italy shows a deceleration that cuts across sectors. Graphically Italy shows a deceleration that cuts across sectors.Across the euro area and in the United Kingdom, industrial production has turned more mixed. In February, Germany and France are up while Spain, Italy and the UK are lower. For now the 3-month trends in German and French industrial production are very strong. We await the final tabulations to give us new results for the zone itself. But several of the larger economies are struggling. And Germany does not itself yet have strong domestic demand to feed off of. Strong trade ties with China and the US have helped to keep German output advancing. But the UK and Italy show faltering trends; Spain is uneven. Germany and France show continued acceleration in output. For Germany the trend is ingrained,. For France it was not present in January and has only emerged in February. While forecasts for the Euro area have all been upbeat there is a decided dark cloud hanging over the region. Italy is just one example. The downward revision to EMU-wide consumption in revised GDP is another. Still, Euro optimism springs eternal. |
| SAAR except m/m | Mo/Mo | Feb-07 | Jan-07 | Feb-07 | Jan-07 | Feb-07 | Jan-07 | ||
| Euro area Detail | Feb-07 | Jan-07 | Dec-06 | 3-Mo | 3-Mo | 6-mo | 6-mo | 12-mo | 12-mo |
| Germany: | 0.8% | 1.0% | 0.1% | 8.1% | 11.6% | 6.9% | 8.5% | 8.2% | 8.2% |
| France: IP ex Construction | 1.1% | -0.2% | 1.0% | 7.7% | 2.0% | 1.6% | 1.0% | 2.6% | -0.4% |
| Italy | -0.4% | -1.6% | 1.6% | -1.6% | 0.0% | -0.2% | 4.0% | 2.1% | 3.6% |
| Spain | -5.3% | 9.3% | -3.0% | 1.9% | 24.2% | -2.0% | 22.6% | 5.2% | 9.2% |
| UK | -0.6% | -0.2% | 0.1% | -2.7% | 0.4% | -1.4% | 0.6% | 1.2% | 1.9% |

Robert Brusca
AuthorMore in Author Profile »Robert A. Brusca is Chief Economist of Fact and Opinion Economics, a consulting firm he founded in Manhattan. He has been an economist on Wall Street for over 25 years. He has visited central banking and large institutional clients in over 30 countries in his career as an economist. Mr. Brusca was a Divisional Research Chief at the Federal Reserve Bank of NY (Chief of the International Financial markets Division), a Fed Watcher at Irving Trust and Chief Economist at Nikko Securities International. He is widely quoted and appears in various media. Mr. Brusca holds an MA and Ph.D. in economics from Michigan State University and a BA in Economics from the University of Michigan. His research pursues his strong interests in non aligned policy economics as well as international economics. FAO Economics’ research targets investors to assist them in making better investment decisions in stocks, bonds and in a variety of international assets. The company does not manage money and has no conflicts in giving economic advice.
More Economy in Brief