 Global| Nov 23 2009
U.S. Existing Home Sales Surge ToHighest Since 2007 As Prices Fall Again
by:Tom Moeller
|in:Economy in Brief
Summary
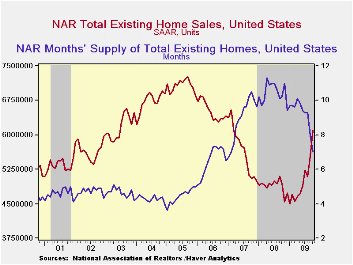
Improved affordability is a great help when buying a home. The National Association of Realtors reported that October sales of existing homes rose sharply to the highest level since July 2007. The 10.1% m/m increase to 6.100M units [...]
 Improved affordability is a great help when buying a home. The
National Association of Realtors reported that October sales of
existing homes rose sharply to the highest level since July
2007. The 10.1% m/m increase to 6.100M units (SAAR) followed an 8.8%
rise during September and it raised sales to the highest level since
February 2007. Moreover, sales were up by more than one-third from the
January low. The gain in October home sales outpaced Consensus
expectations for a rise to 5.70M. Total sales include sales of condos
and co-ops.
Improved affordability is a great help when buying a home. The
National Association of Realtors reported that October sales of
existing homes rose sharply to the highest level since July
2007. The 10.1% m/m increase to 6.100M units (SAAR) followed an 8.8%
rise during September and it raised sales to the highest level since
February 2007. Moreover, sales were up by more than one-third from the
January low. The gain in October home sales outpaced Consensus
expectations for a rise to 5.70M. Total sales include sales of condos
and co-ops.
Sales of existing single-family homes alone increased a sharp 9.7% to 5.330M (21.4% y/y) last month and were up 20.7% from the January low. (These data have a longer history than the total sales series). Sales of condos and co-ops rose 13.2% and were up by nearly one-half from last October.
Sales have been helped by a recently extended tax credit for
first-time home buyers. The credit of up to $8,000 runs though early
next year. The full details of the home-buyer tax credit can be found here.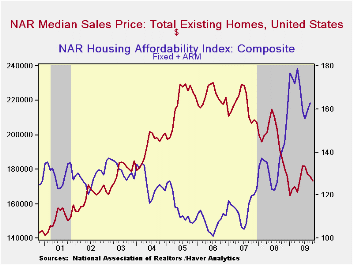
The median price of all existing homes fell for the fourth straight month, to $173,100. Though prices were still lower than the year-ago level, they have risen 5.0% from the January low. The median price for a single-family home alone fell to $173,100 (-6.8% y/y). These price declines have sharply raised home affordability. During September the composite index of home affordability rose again and was up 18.2% from the year ago level.
The number of unsold homes (condos & single-family) for sale fell 3.7% (-14.9% y/y) during October fell to the lowest level since January 2007. At the current sales rate there was a 7.0 months' supply of homes on the market which was nearly the lowest since early-2007. The latest figure was down from a high of 11.3 months early last year. For single-family homes, the inventory fell 3.2% m/m (-14.3% y/y). At the current sales rate there was a 6.8 month's supply of single-family homes on the market, the lowest since early-2007.
The data on existing home sales, prices and affordability can be found in Haver's USECON database. The regional price, affordability and inventory data is available in the REALTOR database.
Preventing a Repeat of the Money Market Meltdown of the Early-1930s from the Federal Reserve Bank of Dallas can be found here
.| Existing Home Sales (Thous, SAAR) | October | September | August | Oct. Y/Y | 2008 | 2007 | 2006 |
|---|---|---|---|---|---|---|---|
| Total | 6,100 | 5,540 | 5,090 | 23.5% | 4,893 | 5,674 | 6,516 |
| Northeast | 1,060 | 950 | 910 | 27.7 | 845 | 1,010 | 1,093 |
| Midwest | 1,430 | 1,250 | 1,140 | 28.8 | 1,130 | 1,331 | 1,494 |
| South | 2,300 | 2,040 | 1,890 | 25.7 | 1,860 | 2,243 | 2,577 |
| West | 1,310 | 1,290 | 1,150 | 12.0 | 1,064 | 1,095 | 1,357 |
| Single-Family | 5,330 | 4,860 | 4,470 | 21.4 | 4,341 | 4,960 | 5,712 |
| Median Price, Total, $ | 173,100 | 176,000 | 177,300 | -7.1 | 197,250 | 216,633 | 222,042 |
Chicago Fed Index Eases Again Pointing Towards Softer GDP Growth
by Tom Moeller November 23, 2009
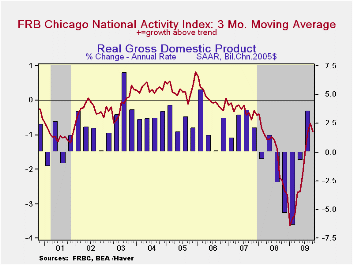 The upward momentum in the U.S. economy sagged during the last
few months. That's the message from lower readings of the Chicago Fed
National Activity Index (CFNAI) from the Federal Reserve Bank of
Chicago. The index slipped again m/m after having improved sharply from
the January low. The October reading of -1.08 was off slightly from
-1.01 during September. Nevertheless, both figures are greatly improved
from the series' low of -4.13 reached this past January. Since 1970
there has been a 74% correlation between the level of the index and the
q/q change in real GDP but during the last ten years that correlation
has risen to 80%.
The upward momentum in the U.S. economy sagged during the last
few months. That's the message from lower readings of the Chicago Fed
National Activity Index (CFNAI) from the Federal Reserve Bank of
Chicago. The index slipped again m/m after having improved sharply from
the January low. The October reading of -1.08 was off slightly from
-1.01 during September. Nevertheless, both figures are greatly improved
from the series' low of -4.13 reached this past January. Since 1970
there has been a 74% correlation between the level of the index and the
q/q change in real GDP but during the last ten years that correlation
has risen to 80%.
The three-month moving average which smoothes out some of the volatility of the index also slipped m/m but remained near its highest level since February of 2008.
An index level at or below -0.70 typically has indicated negative U.S. economic growth. A zero value of the CFNAI indicates that the economy is expanding at its historical trend rate of growth of roughly 3%. The complete CFNAI report is available here.
The Chicago Fed indicated in its data release that the level
of the CFNAI "indicates low inflationary pressure from economic
activity over the coming year."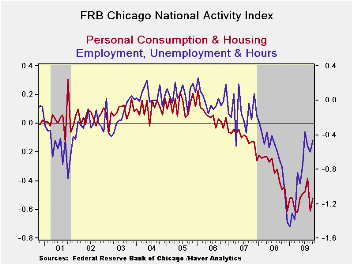
The Chicago Fed indicated that 32 of the series' individual indicators made positive contributions to the October index while 53 made negative contributions. The CFNAI is a weighted average of 85 indicators of economic activity. The indicators reflect activity in the following categories: production & income, the labor market, personal consumption & housing, manufacturing & trade sales, and inventories & orders.
In a separate survey, the Chicago Fed indicated that its Midwest manufacturing index improved during September after an upwardly revised August reading. As a result, a discernable uptrend in the index now is evident versus the June low. Indicators for the auto, steel, and resource sectors improved while the reading for the machinery sector hit a new low. The Chicago Federal Reserve figures are available in Haver's SURVEYS database.
Rescuing asset-backed securities markets from the Federal Reserve Bank of Chicago is available here.
| Chicago Fed | October | September | August | October '08 | 2008 | 2007 | 2006 |
|---|---|---|---|---|---|---|---|
| CFNAI | -1.08 | -1.01 | -0.63 | -1.48 | -1.77 | -0.35 | 0.05 |
| 3-Month Moving Average | -0.91 | -0.67 | -0.94 | -2.31 | -- | -- | -- |
| Personal Consumption & Housing | -0.52 | -0.61 | -0.38 | -0.46 | -0.33 | -0.10 | 0.06 |
| Employment Unemployment & Hours | -0.46 | -0.60 | -0.53 | -0.77 | -0.62 | -0.15 | 0.01 |
| Production & Income | -0.07 | 0.23 | 0.53 | 0.07 | -0.55 | -0.05 | -0.01 |
| Sales, Inventories & Orders | -0.02 | -0.04 | -0.25 | -0.31 | -0.24 | -0.06 | -0.01 |
Although Stresses Vary, All States Endure Doubling Of Unemployment
by Tom Moeller November 23, 2009
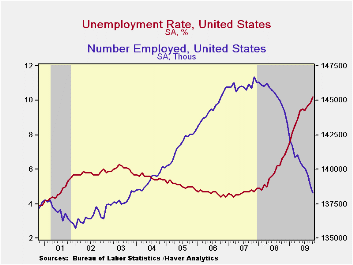
Overall, the U.S. unemployment rate touched 10.2% during
October, just shy of the 10.8% postwar-record reached in December 1982.
That, however, understates the severity of joblessness. In virtually
all 50 states, since 2007 there has been a doubling of the unemployment
rate. Currently, unemployment rates range from the high of 15.1% in
Michigan to the low of 4.2% in North Dakota. The jobless rate may even
rise further as it did after the last two recessions ended when the
labor force increased faster than employment. Conversely, a
"double-dip" recession this time, as some foresee, would raise
unemployment significantly higher.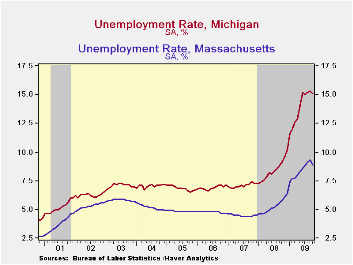
Michigan tops the list of states with the highest unemployment rate. (See table.) With its large exposure to the auto industry, Michigan saw its unemployment rate more-than-double to 15.1%. Since early last year, the number of unemployed in Michigan also has doubled to 733,000.Last month's cash-for-clunkers vehicle sales incentive program briefly stemmed the increase, but only a sustained rise in sales will encourage vehicle manufacturers to increase hiring.
Amongst other large states, California has suffered the
enormously. The downturn in the high-tech sector and red-ink in the
state's budget has caused the unemployment rate also to
more-than-double to 12.5% from its low, but that understates the
severity of the situation. With its larger population, the rate
increase represents a 1.4 million gain in the number of unemployed.In
Florida, the severity of the unemployment rate's near-tripling to 11.2%
is due to a depressed tourism industry and reduced construction
activity. The number of unemployed rose by three-quarters of a million
persons. In Ohio, employment also relies heavily on the auto industry
though some stabilization is provided by the food-processing industry
and Wal-Mart's headquarters. Thus, the near-doubling of its
unemployment rate to 10.5% from last year reflects lower motor vehicle
production and an increase of roughly 300,000 in the number unemployed.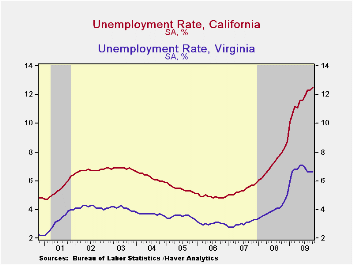
Perhaps a more diverse pool of industries has helped those states with unemployment rates lower than the national average. In Texas, with 12.1 million in the labor force, the strength in oil prices and the stability of the food industry have held the unemployment rate below the national average. Nevertheless, the number of unemployed has risen by one-half million since its 2007 low and the jobless rate has nearly doubled to 8.3%. In Massachusetts, with the workforce heavily exposed to the education & government sectors, the unemployment rate also has held below the national average at 8.9%. Virginia also has its disproportionate exposure to the government sector to help explain a relatively low unemployment rate of 6.6% last month. Nevertheless, the number of unemployed has doubled by 160,000.
Agriculture is the mainstay of North Dakota's economy which
has enabled its unemployment rate to remain the lowest in the country.
Nevertheless, at 4.2% the rate is up from the 3.0% low as the number of
unemployed rose by one-quarter to 15,100 from last year. In Nebraska,
unemployment also remained low due to a large agriculture sector as
well as large education & health sectors.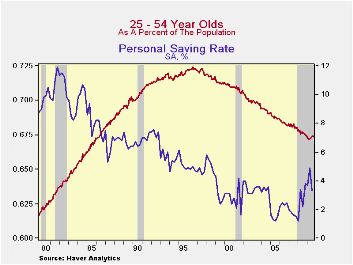
Currently, the National Association of Business Economists forecasts 3.0% growth in the economy for 2010. That would result in little, if any, reduction in the unemployment rate since 3.0% barely exceeds the economy's growth potential. Some near-term boost to GDP growth could always occur due to a rebound in inventories, which have been depressed, or from heightened government spending, a sure bet. However, the more potent source for a quicker recovery would be consumer spending, but two factors suggest that a sustained boost is unlikely. For one, too much debt accumulation caused the savings rate to crater from 1980 through 2008. It only recently has edged higher. Secondly, the aging of the big-spending, baby-boom generation as a percent of the total has been underway for more than ten years and will continue. That means less force behind purchases of homes and consumer durables. Thus, relatively high unemployment rates seem likely for the foreseeable future.
The data used in this report can be found in Haver's EMPLR and USECON databases.
The long and large decline in state employment growth volatility from the Federal Reserve Bank of Philadelphia can be found here.
| Unemployment (%) | October | September | August | Oct. '08 | 2008 | 2007 | 2006 |
|---|---|---|---|---|---|---|---|
| Selected Highest States | |||||||
| Michigan | 15.1 | 15.3 | 15.2 | 9.1 | 8.4 | 7.1 | 6.9 |
| Nevada | 13.0 | 13.3 | 13.2 | 7.7 | 6.7 | 4.7 | 4.3 |
| California | 12.5 | 12.3 | 12.3 | 8.0 | 7.2 | 5.4 | 4.9 |
| South Carolina | 12.1 | 11.7 | 11.4 | 7.8 | 6.9 | 5.6 | 6.3 |
| Florida | 11.2 | 11.1 | 10.8 | 6.9 | 6.2 | 4.1 | 3.4 |
| Ohio | 10.5 | 10.1 | 10.8 | 6.9 | 6.5 | 5.6 | 5.4 |
| U.S. Average | 10.2 | 9.8 | 9.7 | 6.6 | 5.8 | 4.6 | 4.6 |
| Selected Lowest States | |||||||
| Indiana | 9.8 | 9.7 | 9.9 | 6.4 | 5.9 | 4.6 | 5.0 |
| Massachusetts | 8.9 | 9.3 | 9.1 | 5.8 | 5.3 | 4.5 | 4.8 |
| Texas | 8.3 | 8.2 | 8.0 | 5.3 | 4.9 | 4.4 | 5.0 |
| Maryland | 7.3 | 7.2 | 7.1 | 4.8 | 4.4 | 3.5 | 3.8 |
| Virginia | 6.6 | 6.6 | 6.6 | 4.3 | 4.0 | 3.0 | 3.0 |
| Nebraska | 4.9 | 4.9 | 5.0 | 3.6 | 3.3 | 3.0 | 3.0 |
| North Dakota | 4.2 | 4.1 | 4.3 | 3.2 | 3.1 | 3.1 | 3.2 |
Euro Area Flash PMIs
by Robert Brusca November 23, 2009
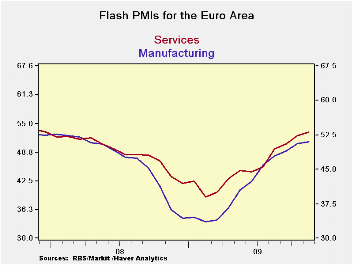
The Euro Area FLASH PMIs are on the rise in November. The
flash Services reading is at its highest reading since November 2007.
The MFG index is at its highest since March 2008. It is the second
consecutive MFG reading above 50 and the third consecutive reading
above 50 for services. Readings above 50 indicate expansion.
However, the percentage increase in the Yr/Yr readings for MFG and for
services each have receded for two months running as the pace of the
recovery’s improvement is slowing.
Since March of 2009 the MFG index has improved by 2.4 points per month
on average. Each monthly increase has been a gain of one point or
better until this month, November 2009, when the improvement was just
0.32 points.
Over this same span the services index averaged a monthly increase of
1.66 per month. However, in June of 2009 the e-Zone Services measure
did decline by 0.17 points interrupting a string of increases. Except
for that drop this month’s rise of 0.82 is the weakest since March of
2009.
Both services and MFG sectors continue to increase but are doing so at
increasing slower rates. This is despite the fact that they reside only
in the mid to low 60th percentile of their respective ranges, ranges
that extend back to July of 1998 for both of them (the MFG range does
have a bit longer history, however0.
Manufacturing stands at a flash reading of 50.98 compared to an average
reading of 51.09 since July of 1998. For services the current 53.17
reading compares to an average reading of 53.69. Both readings are
slowing their pace of increase while still below their respective cycle
averages. This is not good news if there is any expectation of strong
recovery in Europe. Germany may be contributing to the slow down since
its own program to stimulate car purchases has wound down. Other
nations also had a car sales promotion programs that have wound down.
So maybe some of the slowing can be explained away. But that still
leaves a question about what will speed the pace of recovery back up.
If the answer is ‘nothing,’ then the caveat does not amount to much.
For now recovery remain is gear but it is slowing.
| FLASH Readings | ||
|---|---|---|
| Markit PMIs for the Euro Area | ||
| MFG | Services | |
| Nov-09 | 50.98 | 53.17 |
| Oct-09 | 50.73 | 52.58 |
| Sep-09 | 49.29 | 50.86 |
| Aug-09 | 48.24 | 49.92 |
| Segment averages | ||
| 3-Mo | 49.42 | 52.04 |
| 6-Mo | 46.30 | 49.29 |
| 12-Mo | 40.50 | 45.59 |
| 136-Mo Range | ||
| High | 60.47 | 62.36 |
| Low | 33.55 | 39.24 |
| % Range | 64.7% | 60.3% |
Thailand Adds To The Asian Recovery
by Louise Curley November 23, 2009
 Thailand
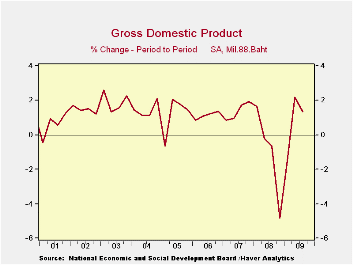
continues to recover from recession. On a quarter to quarter basis the
third quarter Real Gross Domestic Product rose 1.35% compared
with 2.27% in the second quarter, as shown in the first
chart. The smaller increase in the third quarter was due in
part to a much greater increase in imports than in exports and an
increase in the pace of inventory liquidation. While exports
increased by 46 billion baht from the second to the third quarter,
imports rose by 48 billion bahts, reducing the favorable balance on
trade in goods and service by 2 billion bahts. The 17 billion
baht decline in inventories in the third quarter was almost double the
9 billion baht decline in the second quarter.
Thailand
continues to recover from recession. On a quarter to quarter basis the
third quarter Real Gross Domestic Product rose 1.35% compared
with 2.27% in the second quarter, as shown in the first
chart. The smaller increase in the third quarter was due in
part to a much greater increase in imports than in exports and an
increase in the pace of inventory liquidation. While exports
increased by 46 billion baht from the second to the third quarter,
imports rose by 48 billion bahts, reducing the favorable balance on
trade in goods and service by 2 billion bahts. The 17 billion
baht decline in inventories in the third quarter was almost double the
9 billion baht decline in the second quarter.
 The
other components of GDP showed gains: Private Consumption was
up 1.7%, Government Consumption, 0.9% and Gross Fixed investment,
5.8%. The statistical discrepancy was up almost 25%, but
because of its small size, it has little impact on the rate of
growth.
The
other components of GDP showed gains: Private Consumption was
up 1.7%, Government Consumption, 0.9% and Gross Fixed investment,
5.8%. The statistical discrepancy was up almost 25%, but
because of its small size, it has little impact on the rate of
growth.
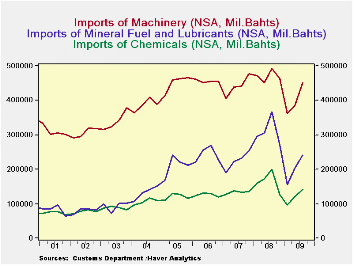
An increase in imports is frequently seen as the beginning of a recovery or expansion of activity in most economies and particularly in emerging economies. They need more raw materials and machinery than they produce domestically to meet growing domestic and foreign demands. The second chart shows Thailand's imports of Mineral Fuels and Lubricants, Chemicals and Machinery as an illustration of this type of import.
Both sets of data are found in Haver's EMERGEPR database.
| THAILAND | Q3 09 | Q2 09 | Q/Q Change | Q/Q % |
|---|---|---|---|---|
| GDP (BIL BAHTS) | 1067.5 | 1053.3 | 14.2 | 1.35 |
| Private Consumption | 562.6 | 553.0 | 9.6 | 1.74 |
| Government Consumption | 105.6 | 104.7 | 1.0 | 0.94 |
| Gross Fixed Capital Formation | 228.7 | 216.1 | 12.6 | 5.81 |
| Change in Inventory | -17.4 | -9.2 | -8.2 | - |
| Net Exports of Goods and Services | 180.4 | 182.7 | -2.2 | - |
| Exports | 691.9 | 645.9 | 46.0. | 4.12 |
| Imports | 511.5 | 463.2 | 48.2 | - |
| Statistical Discrepancy | 7.5 | 6.0 | 1.5 | 24.78 |

Tom Moeller
AuthorMore in Author Profile »Prior to joining Haver Analytics in 2000, Mr. Moeller worked as the Economist at Chancellor Capital Management from 1985 to 1999. There, he developed comprehensive economic forecasts and interpreted economic data for equity and fixed income portfolio managers. Also at Chancellor, Mr. Moeller worked as an equity analyst and was responsible for researching and rating companies in the economically sensitive automobile and housing industries for investment in Chancellor’s equity portfolio. Prior to joining Chancellor, Mr. Moeller was an Economist at Citibank from 1979 to 1984. He also analyzed pricing behavior in the metals industry for the Council on Wage and Price Stability in Washington, D.C. In 1999, Mr. Moeller received the award for most accurate forecast from the Forecasters' Club of New York. From 1990 to 1992 he was President of the New York Association for Business Economists. Mr. Moeller earned an M.B.A. in Finance from Fordham University, where he graduated in 1987. He holds a Bachelor of Arts in Economics from George Washington University.
More Economy in Brief


