 Global| Nov 28 2005
U.S. Existing Home Sales Soften
by:Tom Moeller
|in:Economy in Brief
Summary
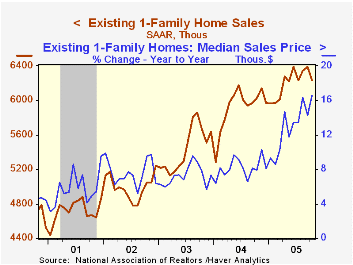
Total existing home sales fell 2.7% m/m to 7.090M (AR) in October according to the National Association of Realtors. The September level of sales was revised slightly higher. Consensus expectations for sales last month had been for [...]
The latest release from the National Association of Realtors is available here.
| Existing Home Sales (000, AR) | Oct | Sept | Y/Y | 2004 | 2003 | 2002 |
|---|---|---|---|---|---|---|
| Total Home Sales | 7,090 | 7,290 | 3.7% | 6,723 | 6,170 | 5,653 |
| Single Family Home Sales | 6,230 | 6,390 | 3.3% | 5,913 | 5,441 | 4,995 |
| Single Family Median Home Price ($,000) | $216.2 | $21 2.2 | 16.6% | $182.8 | $169.1 | $157.6 |
by Tom Moeller November 28, 2005

Mass layoffs fell in half last month from a September count that was bloated by establishment closures due to Hurricanes Katrina & Rita. Year to year, the number of mass layoffs also fell by 14.6%, continuing the downtrend in place since 2001.
During the last ten years there has been a (negative) 87% correlation between the three month average level of layoff announcements and the y/y change in payroll employment.
The number of persons affected by mass layoffs in October fell nearly two-thirds m/m.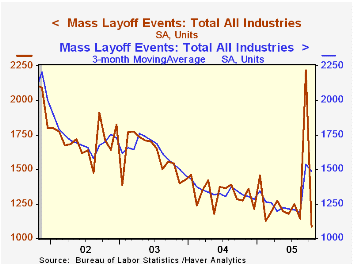
By industry, factory sector layoff announcements in October more than reversed the prior month's increase. The number of layoff events as a result fell below the year earlier level but the number of persons affected nevertheless rose 1.5% y/y with increases concentrated in the transportation, computer and paper industries.
The Mass Layoff Statistics (MLS) program collects reports on mass layoff actions that result in workers being separated from their jobs. Monthly mass layoff numbers are from establishments which have at least 50 initial claims for unemployment insurance (UI) filed against them during a 5-week period.
How Predictable is Fed Policy? from St. Louis Federal Reserve Bank President William Poole can be found here.
| Mass Layoffs | Oct | Sept | Y/Y | 2004 | 2003 | 2002 |
|---|---|---|---|---|---|---|
| All US Industries (# Events, SA) | 1,088 | 2,220 | -14.6% | 15,900 | 19,155 | 20,472 |
| Total (# Persons, SA) | 106,238 | 287,692 | -15.3% | 1,588,483 | 1,936,463 | 2.256,014 |
by Louise Curley November 28, 2005

The statistical offices of the former components of Czechoslovakia--the Czech and Slovak Republics released data on business and consumer confidence this morning.Each country produces measures of consumer and industrial confidence and a composite measure of confidence.
The Composite Indicator for Czech Republic is a weighted average of seasonally adjusted confidence indicators for industry, construction, trade and of the consumer expressed in terms of percent balances. The Slovak Economic Sentiment Indicator, expressed in terms of an index with base 2000=100), is composed of the industrial confidence indicator (40%), the construction confidence indicator (20%), the retail trade confidence indicator (20%) and the consumer confidence indicator (20%). It is not possible to compare the degree of overall confidence in the two countries, since one measure is expressed in index form and the other a percent balance, but trends in the two measures can be compared. The trend in the Slovak Economic Sentiment Index has shown a marked improvement since early 2004. In November the index was up 2.37% from October and 4.06% from November, 2004. The trend in the composite measure of confidence for the Czech Republic was down after a big improvement in early 2004 but has begun to improve since August of this year. The percent balance in November was unchanged from October when it stood at 8 and was 2 percentage points above November, 2004. The trends in the two composite measures are shown in the first chart.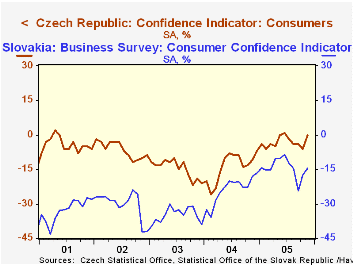
Since measures of consumer and business in both countries are expressed in terms of percent balances it is possible to compare the degree of consumer and industrial confidence in the countries. The fact that the percent balance in consumer confidence in the Czech Republic was 0 in November while that in Slovakia was -14.6 suggests that there are more pessimistic consumers than optimistic ones in Slovakia in November than in the Czech Republic. This has been true over the past five years and can be seen in the second chart.
Although the Slovak economy has been increasing faster than that of the Czech Republic, business confidence is moderately below that of the Czech Republic. In November the excess of business optimists over pessimists was 6.7% compared with 3.0% in October and 8.7% a year ago. The corresponding figures for the Czech Republic were 10%, 11% and 10%. The third chart comparing the percent balances in business confidence in the two countries shows some improvement in recent months.
| Czech and Slovak Republic: Confidence Measures (% balance) |
Nov 05 % | Oct 05 % | Nov 04 % | M/M % Pts |
Y/Y % Pts |
2004 % | 2003 % | 2002 % |
|---|---|---|---|---|---|---|---|---|
| Composite | ||||||||
| Czech Republic | 8 | 8 | 6 | 0 | 2 | 4 | 1 | 2 |
| Slovak Republic* | 112.9 | 110.3 | 108.5 | 2.36 | 4.06 | 106.2 | 105.3 | 105.2 |
| Consumer Confidence | ||||||||
| Czech Republic | 0 | -6 | -4 | 6 | 4 | -13 | -15 | -7 |
| Slovak Republic | -14.6 | -17.3 | -18.1 | 2.7 | 3.5 | -22.9 | -34.8 | -30.2 |
| Business Confidence | ||||||||
| Czech Republic | 10 | 11 | 10 | -1 | 0 | 8 | 5 | 4 |
| Slovak Republic | 6.7 | 3.0 | 8.7 | 3.7 | -2.0 | 6.8 | 4.6 | 4.6 |

Tom Moeller
AuthorMore in Author Profile »Prior to joining Haver Analytics in 2000, Mr. Moeller worked as the Economist at Chancellor Capital Management from 1985 to 1999. There, he developed comprehensive economic forecasts and interpreted economic data for equity and fixed income portfolio managers. Also at Chancellor, Mr. Moeller worked as an equity analyst and was responsible for researching and rating companies in the economically sensitive automobile and housing industries for investment in Chancellor’s equity portfolio. Prior to joining Chancellor, Mr. Moeller was an Economist at Citibank from 1979 to 1984. He also analyzed pricing behavior in the metals industry for the Council on Wage and Price Stability in Washington, D.C. In 1999, Mr. Moeller received the award for most accurate forecast from the Forecasters' Club of New York. From 1990 to 1992 he was President of the New York Association for Business Economists. Mr. Moeller earned an M.B.A. in Finance from Fordham University, where he graduated in 1987. He holds a Bachelor of Arts in Economics from George Washington University.
More Economy in Brief


