 Global| Jun 22 2010
U.S. Existing Home Sales Slip
by:Tom Moeller
|in:Economy in Brief
Summary
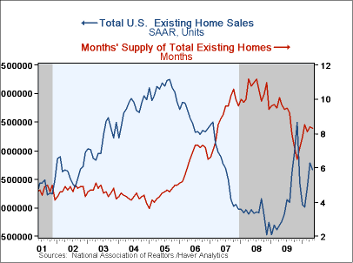
Sales of existing single-family home sales slipped following the expiration of a Federal home-buyer tax credit. Existing home sales fell 2.2% to 5.660M last month following April's little revised 8.0% increase according to the [...]
 Sales of existing
single-family home sales slipped following the expiration of a Federal
home-buyer tax credit. Existing home sales fell 2.2% to 5.660M last
month following April's little revised 8.0% increase according to the
National Association of Realtors. May sales disappointed Consensus
expectations for sales of 6.16M. Total sales include sales of condos
and co-ops. Sales of existing single-family homes alone fell 1.6% from
April to 4.980M. (These data have a longer history than the total sales
series). Sales of condos and co-ops rose 32.6% from last year.
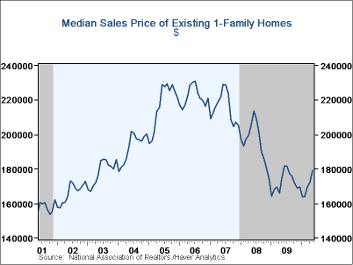
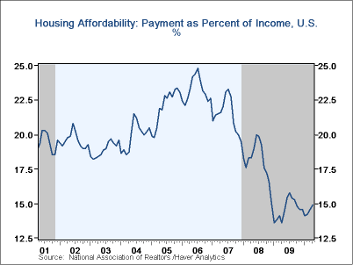
The median price of all existing homes rose in May to $179,600. Though prices remained off roughly 25% from the 2007 peak they have risen 9.1% from the February low. The price of a single-family home rose 4.0% to $179,400 (2.7% y/y). Earlier price weakness sharply raised home affordability -- by three-quarters from the 2006 low. This rise in home prices lowered homes' affordability by 9.5% versus one year ago. The median family income for existing home buyers was $60,498 and mortgage payments amounted to 14.9% of that total.
The number of unsold homes (single-family & co-ops) for sale slipped m/m but remained up 1.1% y/y. At the current sales rate there was an 8.3 months' supply of homes on the market. That was down from a high of 10.1 months during April of 2008. For single-family homes, the inventory fell m/m to a 7.8 months' supply.
The data on existing home sales, prices and affordability can be found in Haver's USECON database. The regional price, affordability and inventory data is available in the REALTOR database.
The Homeownership Gap from the Federal Reserve Bank of New York is available here.
| Existing Home Sales (Thous, SAAR) | May | April | March | May Y/Y | 2009 | 2008 | 2007 |
|---|---|---|---|---|---|---|---|
| Total | 5,660 | 5,790 | 5,360 | 19.2% | 5,160 | 4,893 | 5,674 |
| Northeast | 890 | 1,090 | 900 | 12.7 | 863 | 845 | 1,010 |
| Midwest | 1,330 | 1,330 | 1,210 | 22.0 | 1,166 | 1,130 | 1,331 |
| South | 2,150 | 2,140 | 1,970 | 22.9 | 1,913 | 1,860 | 2,243 |
| West | 1,290 | 1,230 | 1,290 | 15.2 | 1,216 | 1,064 | 1,095 |
| Single-Family Sales | 4,980 | 5,060 | 4,700 | 17.5 | 4,573 | 4,341 | 4,960 |
| Median Price, Total, $ (NSA) | 179,600 | 172,300 | 169,600 | 2.7 | 172,742 | 197,233 | 216,633 |
by Tom Moeller June 22, 2010
 Petroleum prices have firmed recently. The pump
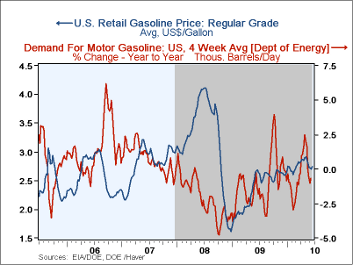
price for regular gasoline of $2.74 per gallon
last week was its highest in four weeks and prices were up more than
three-quarters since the December 2008 low. Holding firm yesterday was
the spot market price for a gallon of regular gasoline at $2.07 which
was the highest level since early last month. The figures are reported
by the U.S. Department of Energy and can be
found in Haver's WEEKLY & DAILY databases.
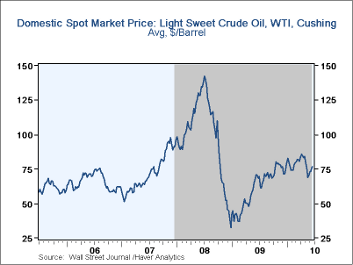
Continuing higher last week to $76.74 was the average price for a barrel of light sweet crude (WTI). Nevertheless the price remained down from the high of $84.23 averaged during April. Yesterday crude prices moved higher to $77.82 per barrel, up from the May 24th low of $66.88.
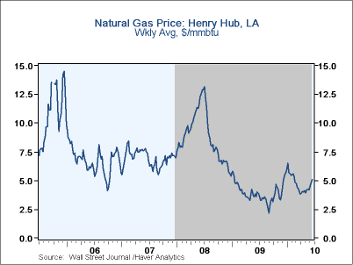
U.S. natural gas prices also have strengthened of late to an average $5.10 per mmbtu (26.7% y/y), the highest level since early-March. Nevertheless, prices remained down from a high of $6.50 early in January.
Demand for gasoline eased 0.7% last week versus one year ago and that compares to a 0.9% increase last month. The demand for residual fuel oil fell a sharp 14.2% versus last year while distillate demand continued to surge by 12.5% y/y. That's improved from a 12.3% decline during February. Inventories of crude oil and petroleum products continued to slip versus last year but still were up sharply from the early-2010 low.
The energy price data can be found in Haver's WEEKLY database while the daily figures are in DAILY. The gasoline demand figures are in OILWKLY.
by Tom Moeller June 22, 2010
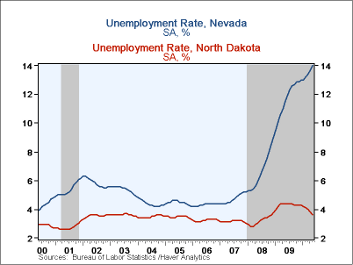
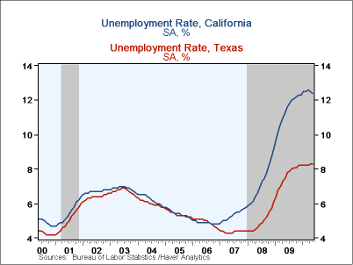
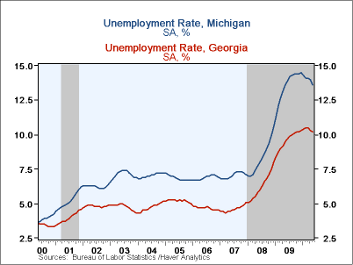
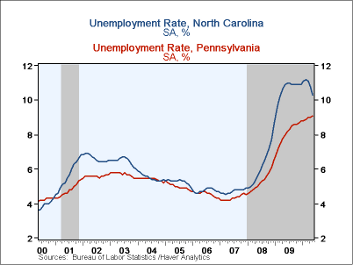
By state, how widely does unemployment vary in the United States? Amazingly, it varies by ten percentage points according to figures released last week by the Census Department. From high to low, the unemployment rates ranged from 14.0% in Nevada to 3.6% in North Dakota. However, the detail contained in this release was as notable as the headline figure. To start, the unemployment rate was nearly 13.0% in two of the largest states, Michigan and California. Here the combined labor forces are 15.0% of the country's total. The two states at the bottom of the unemployment rate list were North and South Dakota, both close to 4%. But in these two states the combined labor force is less than 1.0% of the country's total.
To further emphasize the disparate range of unemployment, the jobless rate was near or below 7.0% in sixteen states. Combined these states account for 14.8% of the U.S. labor force. At the other end were sixteen states, accounting for roughly half of the U.S. labor force, where unemployment was at the high end of the jobless rate's range, above 10.0%. Two notable exceptions to big states' high unemployment were Texas and New York where unemployment averaged a lower 8.3%.
Employment growth in virtually all states has improved since the recession's end last June. Texas, Louisiana and Vermont have experienced the strongest growth. Unfortunately for most others, improvement has yet to arrive. That notably is true for several of the smallest states including Nevada, Delaware, West Virginia, and Alabama where employment continues to fall significantly.
The data used in this analysis is available in Haver's EMPLR database.
Economic freedom and employment growth in U.S. states from the Federal Reserve Bank of St. Louis is available here.
by Louise Curley June 22, 2010
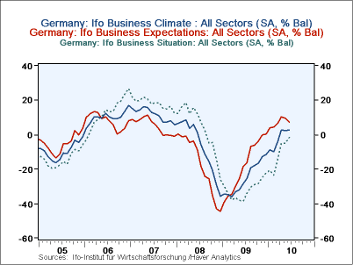
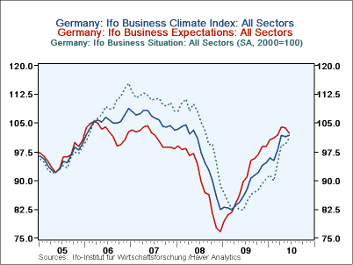 The June
IFO survey of some 7000 responses of firms in manufacturing,
construction and wholesale and retail trade shows a slight improvement
in the business climate to 101.8 (2000=100) from 101.5 in
May. With the sharp decline in expectations in the financial
community revealed earlier this month in the ZEW survey, the consensus
had expected a decline. The rise was due to an improvement in the
appraisal of current conditions from 99.4 in May to 101.1 in June that
outweighed the decline in expectations of economic conditions
six months ahead from 103.7 in May to 102.4 in
June. The business climate index and its component
indexes--the current situation and expectations for the next six
months--are shown in the first chart.
In addition to the data in the form of an index, the IFO also publishes the data in the form of percent balances which we show in the second chart. Trends in the index and in the percent balances are similar, but the percent balances indicate whether the increase in the index is due to increased optimism or decreased pessimism. In June the increase in the index for the current situation from 99.4 in May to 101.1 was due to a decline of 3.3 points in the excess of pessimists over optimists. The pessimists on the Current Situation still outweigh the optimists by 1.6%.
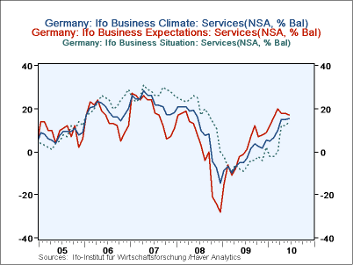
Since May 2001, the IFO has been publishing a survey of the service industry based on the responses of some 2000 firms. The data are in the form of percent balances only and are not seasonally adjusted. The percent balances for the Climate, Expectations and Current Situation in the service industries are shown in the third chart. Comparing the second and third charts, we find that the service industry has generally been more optimistic regarding its current situation and expectation than the industrial sector. The excess of optimists over pessimists in the service industries in June was 15.5% for the Climate, 17.0% for Expectations and 14.0% for the Current Situation, compared with 2.8%, 7.4% and -1.6% respectively, for the industrial sector.
Note: The current release from the IFO is preliminary in that much of the detailed data will not be available until Friday of this week.
Tom Moeller
AuthorMore in Author Profile »Prior to joining Haver Analytics in 2000, Mr. Moeller worked as the Economist at Chancellor Capital Management from 1985 to 1999. There, he developed comprehensive economic forecasts and interpreted economic data for equity and fixed income portfolio managers. Also at Chancellor, Mr. Moeller worked as an equity analyst and was responsible for researching and rating companies in the economically sensitive automobile and housing industries for investment in Chancellor’s equity portfolio. Prior to joining Chancellor, Mr. Moeller was an Economist at Citibank from 1979 to 1984. He also analyzed pricing behavior in the metals industry for the Council on Wage and Price Stability in Washington, D.C. In 1999, Mr. Moeller received the award for most accurate forecast from the Forecasters' Club of New York. From 1990 to 1992 he was President of the New York Association for Business Economists. Mr. Moeller earned an M.B.A. in Finance from Fordham University, where he graduated in 1987. He holds a Bachelor of Arts in Economics from George Washington University.


