 Global| Mar 24 2008
U.S. Existing Home Sales Rose Slightly. Momentum Changing?
by:Tom Moeller
|in:Economy in Brief
Summary
According to the National Association of Realtors, existing home sales in February rose 2.9% m/m to 5.030M from an unrevised January level which fell 0.4%. The rise contrasted with Consensus expectations for a slight decline. There [...]
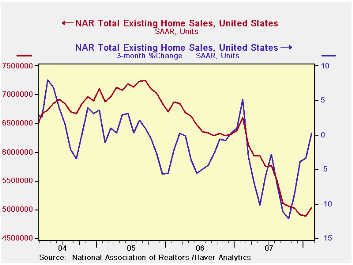
According to the National Association of Realtors, existing home sales in February rose 2.9% m/m to 5.030M from an unrevised January level which fell 0.4%. The rise contrasted with Consensus expectations for a slight decline.
There has been, however, a change from past sales patterns.
The downward momentum behind last year's declines in home sales has
flattened out. Home sales were essentially unchanged during the last
three months following double digit rates of decline during all of last
year.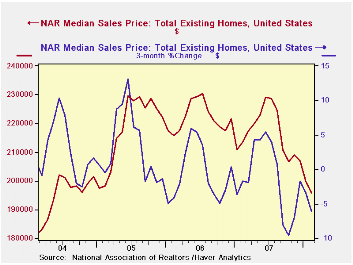
Sales of existing single family homes also rose by 2.8% last month and that followed a 0.7% January uptick.
By region, February home sales in the Northeast rose 11.3% (-26.4% y/y) and recouped all of the declines during the prior two months. In the Midwest February sales rose 2.5% for the second consecutive monthly increase while sales in the South rose a modest 2.1%. That flattening pattern even extends out West. Though sales fell 1.1% in February, the three month rate of decline moderated to -5.2% from -21.4% as of last October.
A flattening of last year's price decline, however, has not occurred. The median price of an existing home fell 1.9% (-8.2% y/y) last month after a downwardly revised 5.3% January drop. Home prices were off 14.5% in February from their peak last June.
The number of unsold homes on the market continued to fall last month. The 3.0% m/m decline pulled the stock down 11.6% from the peak last July. At the current low sales rate, however, that inventory still amounts to a 9.6 months supply which is barely down from last year's peak. For single family homes there is a 9.2 months supply at the current sales rate and for condos and co-ops there is a 13.0 months supply.
Walking a tightrope into 2008 from the Federal Reserve Bank of St. Louis can be found here.
| Existing
Single Family Home Sales (Thous) |
February | y/y % | January | February '07 | 2007 | 2006 | 2005 |
|---|---|---|---|---|---|---|---|
| Total | 5,030 | -23.8 | 4,890 | 6,600 | 5,672 | 6,508 | 7,076 |
| Northeast | 890 | -26.4 | 800 | 1,210 | 1,008 | 1,090 | 1,168 |
| Midwest | 1,240 | -19.5 | 1,210 | 1,540 | 1,331 | 1,491 | 1,589 |
| South | 1,990 | -22.0 | 1,950 | 2,550 | 2,240 | 2,576 | 2,704 |
| West | 920 | -29.2 | 930 | 1,300 | 1,093 | 1,353 | 1,617 |
| Single-Family | 4,470 | -22.9 | 4,350 | 5,590 | 4,958 | 5,703 | 6,181 |
| Median Price, Total, $ | 195,900 | -8.2 | 199,7000 | 213,500 | 216,617 | 222,000 | 218,217 |
by Tom Moeller March 24, 2008
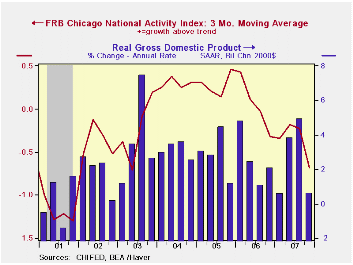
The February National Activity Index (CFNAI) published by the Chicago Federal Reserve fell to its lowest level since April of 2003. At a negative 1.04 following downwardly revised readings in January and December '07 the latest figure lowered the three month moving average to -0.87, its lowest level since 1Q03. That low reading 2003 was then associated with real GDP growth of 0.20% in 4Q02 and of 1.20% in 1Q03.
The Chicago Fed's release indicated "an increasing likelihood that a recession has begun." A zero value of the CFNAI indicates that the economy is expanding at its historical trend rate of growth of roughly 3%. During the last twenty years there has been a 68% correlation between the level of the CFNAI and q/q growth in real GDP.
The complete CFNAI report is available here and the historical data are available in Haver's Surveys database.
During February, each of the four broad categories of indicators — employment, production, consumption and housing — continued to make negative contributions to the CFNAI.
The CFNAI is a weighted average of 85 indicators of economic activity. The indicators reflect activity in the following categories: production & income, the labor market, personal consumption & housing, manufacturing & trade sales, and inventories & orders.
Economic Outlook Symposium: Summary of 2007 results and forecasts for 2008 from the Federal Reserve Bank of Chicago can be found here.
| Chicago Fed | February | January | February '07 | 2007 | 2006 | 2005 |
|---|---|---|---|---|---|---|
| CFNAI | -1.04 | -0.68 | -0.28 | -0.44 | 0.01 | 0.28 |
by Louise Curley March 24, 2008
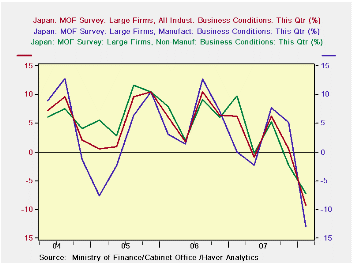
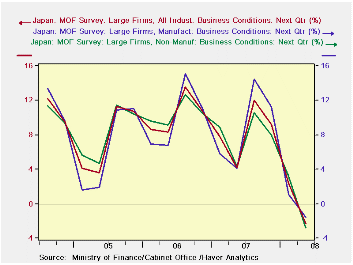
The Japanese Economic and Social Research Institute of the Cabinet Office and the Policy Research Institute of the Ministry of Finance (MOF) have surveyed industry leaders of some 15,000 firms and analyzed their assessments and forecasts of a number of important business trends in the current quarter, the next quarter and the quarter after next. The results are given for large (capital of 1 billion yen and over), medium (capital of 100 million to 1 billion yen) and small (capital of 10 to 100 million yen) businesses. For each size group, results for all industry, manufacturing and non manufacturing industry are given. Complete results of the survey can be found in the Haver series BUSINESS OUTLOOK SURVEY (M0F) in the BUSINESS CYCLE INDICATORS AND SURVEY section of the JAPAN data base. The survey was begun in 2004, and over its short life has tended to anticipate results of the Bank of Japan's Tankan, Japan's most closely watched indicator of the business outlook. The next Tankan results are due on April 1st.
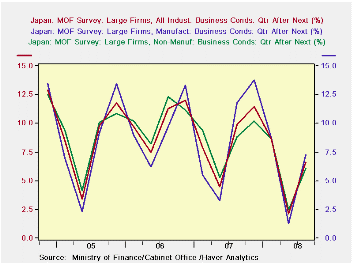
The current Cabinet Office and MOF survey, which was conducted on February 25, was released today. Among the many results of the survey, those for the large firms are frequently high lighted. For all industry in large firms, the pessimists exceeded optimists by 9.3 % in their appraisal of conditions in the current quarter. In non manufacturing industry the excess of pessimists was 7.2%, and for manufacturing, 12.9%. These were the most pessimistic outlooks in the short history of the measure, as can be seen in the first chart. Similar results were shown for the assessment of large manufacturing firms for the next quarter, as shown in the second chart. However, for the quarter after the next, optimists prevailed. The excess of optimists for all industry was 6.6%, for non manufacturing, 6.1% and for manufacturing, 7.3%, as can be seen in the third chart. In general, the appraisals for conditions in the quarter after next show an excess of optimists over pessimists. "Hope spring eternal in the human breast, / Man never is, but always to be blest."
| BUSINESS OUTLOOK SURVEY, CABINET OFFICE & MOF (% Balance) | Q1 08 | Q4 07 | Q1 07 | Q/Q Chg | Y/Y Chg | 2006 | 2005 | 2004 |
|---|---|---|---|---|---|---|---|---|
| Large Firms Current Quarter | ||||||||
| All Industry | -9.3 | 0.5 | 6.2 | -9.8 | -15.5 | 3.0 | 6.2 | 5.4 |
| Manufacturing | -12.9 | 5.2 | 0.1 | -18.1 | -13.0 | 2.7 | 6.1 | 1.7 |
| Non Manufacturing | -7.2 | -2.2 | -9.8 | -5.0 | -17.0 | 3.2 | 6.3 | 7.6 |
| Large Firms Next Quarter | Q2 08 | Q1 08 | Q2 07 | Q/Q Chg | Y/Y Chg | 2006 | 2005 | 2004 |
| All Industry | -2.3 | 2.4 | 4.2 | -4.70 | -6.5 | 8.3 | 10.3 | 7.4 |
| Manufacturing | -1.6 | 1.1 | 4.1 | -2.7 | -5.7 | 6.4 | 10.0 | 8.9 |
| Non Manufacturing | -2.8 | 3.2 | 4.3 | -6.0 | -7.1 | 7.9 | 10.5 | 8.1 |
| Large Firms Quarter after Next | Q3 08 | Q2 08 | Q3 07 | Q/Q Chg | Y/Y Chg | 2006 | 2005 | 2004 |
| All Industry | 6.6 | 2.1 | 9.9 | 4.5 | -3.3 | 8.4 | 10.1 | 8.4 |
| Manufacturing | 7.3 | 1.3 | 11.8 | 6.0 | -4.5 | 8.6 | 9.6 | 8.0 |
| Non Manufacturing | 6.1 | 2.5 | 8.8 | 3.6 | -2.7 | 8.4 | 10.5 | 8.6 |
by Robert Brusca March 24, 2008
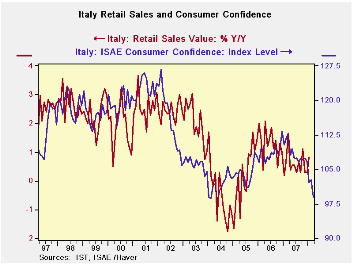
Italy’s retail sales edged up in January, rising by 0.2% in nominal terms, likely a decline in volume terms given the recent pace of inflation. Over the past three months, sales values fell at a 0.4% annual rate. And, overall value growth has been eroding ever so slightly over this period. In the first quarter of 2008 value growth is up at a 0.5% annual pace and at a stronger 0.7% pace for food, beverages and tobacco – both likely representing volume declines.
The chart at the top shows the ISAE consumer sentiment index plotted against retail sales Yr/Yr. Notice that the ISAE index plotted in its raw levels format tends to lead the Yr/Yr decline in retail sales: Sentiment peaks first and rebounds first. It gives reasonably good signals about what retail sales are about to do. In the recent period the weak consumer sentiment readings are pointed to further weakness in Italy’s already weak retail sales.
Italy’s HICP is rising at a 2.9% pace in Q1 (also through January) and its core is up at a 1.5% pace. But in terms of Italy’s own domestic inflation indicator (NIC) inflation is at a 5% pace in the first quarter or 4.6% excluding tobacco (NIC ex-tobacco). Food prices alone in Italy are up at a 5.8% pace in Q1.
As in the table above these inflation statistics for the first quarter growth rates take the January level over the Q4 average (centered in November) and compound that pace. Italy’s Q1 inflation calculated on that same basis produces some dismal implicit estimates of ‘retail sales growth (-2.5% to -4.5% depending on the deflator used). Inflation is clearly outstripping the nominal growth rates for sales in these comparisons by a wide margin. Italy is the most severely impacted economy of the EMU Big Three or EU Big Four (i.e. Germany, France & Italy for EMU, adding the UK for EU).
All of the EMU nations are having a hard time getting retail sales to grow. (The EU’s UK retail sales are an exception to most of the rest of Europe). Germany continues to look for the consumer to fill in some gaps. But flagging confidence is an issue and the EMU industrial sector is slowing. Fear seems to have gripped the EMU nations as the euro has climbed in value despite policymakers extolling European strength and flexibility, and growth has continued to be registered. Someone is either worried about nothing or someone else is whistling past the graveyard. Who is out of touch? Is it the consumer whose pull back is reminiscent of the consumer in the fetal position, or is it the policymaker who is trying to put a brave face on an ugly situation? I report, you decide… For the moment we are in opinion-land on this or deeply into shrink-o-nomics as we try and assess the state of mind of the government official vs the consumer.
| Italy Retail Sales Growth | ||||||||
|---|---|---|---|---|---|---|---|---|
| mo/mo % | At annual rates | |||||||
| Nominal | Jan-08 | Dec-07 | Nov-07 | 3-Mo | 6-Mo | 12-Mo | Yr Ago | Qtr-to-Date |
| Retail Trade | 0.2% | 0.0% | -0.3% | -0.4% | 0.9% | 0.8% | 0.2% | 0.5% |
| Food Bev & Tobacco | 0.1% | 0.1% | -0.1% | 0.3% | 1.9% | 1.7% | -0.3% | 0.7% |
| Clothing&Furniture | 0.7% | 0.2% | -1.5% | -2.6% | 0.4% | 0.7% | 0.5% | 1.7% |

Tom Moeller
AuthorMore in Author Profile »Prior to joining Haver Analytics in 2000, Mr. Moeller worked as the Economist at Chancellor Capital Management from 1985 to 1999. There, he developed comprehensive economic forecasts and interpreted economic data for equity and fixed income portfolio managers. Also at Chancellor, Mr. Moeller worked as an equity analyst and was responsible for researching and rating companies in the economically sensitive automobile and housing industries for investment in Chancellor’s equity portfolio. Prior to joining Chancellor, Mr. Moeller was an Economist at Citibank from 1979 to 1984. He also analyzed pricing behavior in the metals industry for the Council on Wage and Price Stability in Washington, D.C. In 1999, Mr. Moeller received the award for most accurate forecast from the Forecasters' Club of New York. From 1990 to 1992 he was President of the New York Association for Business Economists. Mr. Moeller earned an M.B.A. in Finance from Fordham University, where he graduated in 1987. He holds a Bachelor of Arts in Economics from George Washington University.
More Economy in Brief


