Global| Jun 23 2009
U.S. Existing Home Sales Rise With Affordability And Tax Credit
by:Tom Moeller
|in:Economy in Brief
Summary
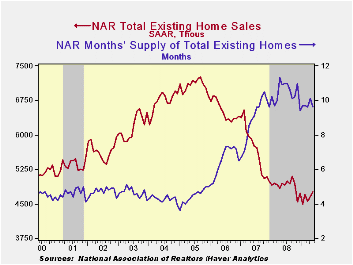
The National Association of Realtors reported that sales of existing homes homes benefited last month from continued gains in home affordability as well as an $8,000 tax credit for first-time home buyers. Sales rose 2.4% last month, [...]
Home affordability recovered most of its April slip and rose to near its record high. The increase came despite a modest m/m gain in home prices from an April level that was revised sharply lower. Home prices remained down by one-quarter from the 2007 peak. The series dates back to 1971.
The recently enacted tax credit is for first-time home buyers of either a new or a pre-owned home. The credit of up to $8,000 extends through the rest of this year. The full details of the home-buyer tax credit can be found here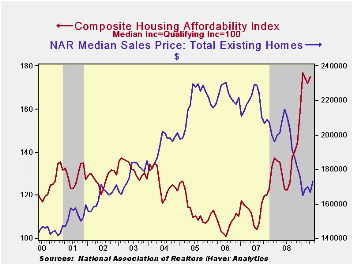
Sales of existing single-family homes alone increased 1.9% last month and they were up 4.9% from the January low. Nevertheless, sales remained near the lowest level since July 1997. (These data have a longer history than the total series).
The number of unsold homes (condos & single-family) on the market reversed roughly half of a sharp April increase with a 3.5% decline and year-to-year inventories are down 15.3%. At the current sales rate there was a 9.6 months' supply on the market which was near the lowest since 2007. For single-family homes the inventory also fell 3.3% (-15.8% y/y). At the current sales rate there was a 9.0 month's supply, near the lowest since 2007.
The data on existing home sales, prices and affordability can be found in Haver's USECON database. The regional price, affordability and inventory data is available in the REALTOR database.
Why has home ownership fallen among the young? from the Federal Reserve Bank of Chicago can be found here.
| Existing Home Sales (Thous) | May | April | Y/Y | 2008 | 2007 | 2006 |
|---|---|---|---|---|---|---|
| Total | 4,770 | 4,660 | -3.6% | 4,893 | 5,674 | 6,516 |
| Northeast | 800 | 770 | -10.1 | 845 | 1,010 | 1,093 |
| Midwest | 1,090 | 1,000 | -4.4 | 1,130 | 1,331 | 1,494 |
| South | 1,740 | 1,740 | -8.9 | 1,860 | 2,243 | 2,577 |
| West | 1,140 | 1,150 | 11.8 | 1,064 | 1,095 | 1,357 |
| Single-Family | 4,250 | 4,170 | -3.0 | 4,341 | 4,960 | 5,712 |
| Median Price, Total, $ | 173,000 | 166,600 | -16.8 | 197,250 | 216,633 | 222,042 |

Tom Moeller
AuthorMore in Author Profile »Prior to joining Haver Analytics in 2000, Mr. Moeller worked as the Economist at Chancellor Capital Management from 1985 to 1999. There, he developed comprehensive economic forecasts and interpreted economic data for equity and fixed income portfolio managers. Also at Chancellor, Mr. Moeller worked as an equity analyst and was responsible for researching and rating companies in the economically sensitive automobile and housing industries for investment in Chancellor’s equity portfolio. Prior to joining Chancellor, Mr. Moeller was an Economist at Citibank from 1979 to 1984. He also analyzed pricing behavior in the metals industry for the Council on Wage and Price Stability in Washington, D.C. In 1999, Mr. Moeller received the award for most accurate forecast from the Forecasters' Club of New York. From 1990 to 1992 he was President of the New York Association for Business Economists. Mr. Moeller earned an M.B.A. in Finance from Fordham University, where he graduated in 1987. He holds a Bachelor of Arts in Economics from George Washington University.
More Economy in Brief
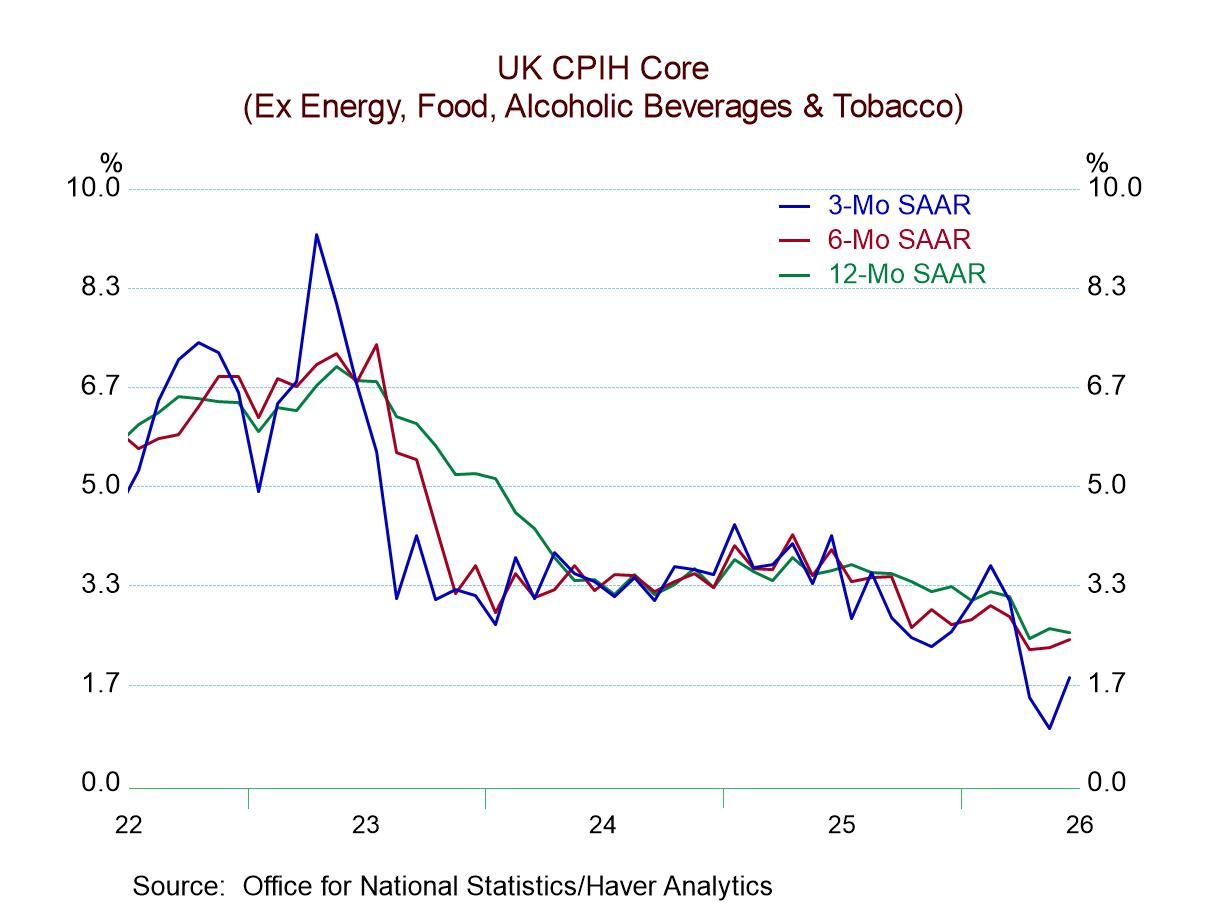
U.K. Headline and Core Inflation Rates Slow Sequentially as BOE Gets Ready to Meet