 Global| Jun 23 2009
U.S. Existing Home Sales Rise With Affordability And Tax Credit
by:Tom Moeller
|in:Economy in Brief
Summary
The National Association of Realtors reported that sales of existing homes homes benefited last month from continued gains in home affordability as well as an $8,000 tax credit for first-time home buyers. Sales rose 2.4% last month, [...]
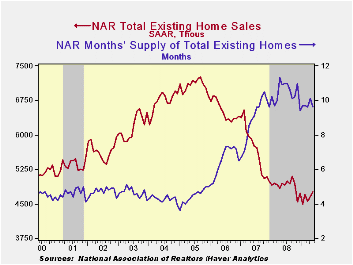
The National Association of Realtors reported that sales of existing homes homes benefited last month from continued gains in home affordability as well as an $8,000 tax credit for first-time home buyers. Sales rose 2.4% last month, the same as they did during April, to 4.77M (AR). Consensus expectations had been for April sales of 4.80M homes. Total sales include sales of condos and co-ops.
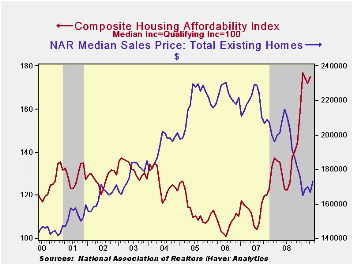
Home affordability recovered most of its April slip and rose to near its record high. The increase came despite a modest m/m gain in home prices from an April level that was revised sharply lower. Home prices remained down by one-quarter from the 2007 peak. The series dates back to 1971.
The recently enacted tax credit is for first-time home buyers of either a new or a pre-owned home. The credit of up to $8,000 extends through the rest of this year. The full details of the home-buyer tax credit can be found here
Sales of existing single-family homes alone increased 1.9% last month and they were up 4.9% from the January low. Nevertheless, sales remained near the lowest level since July 1997. (These data have a longer history than the total series).
The number of unsold homes (condos & single-family) on the market reversed roughly half of a sharp April increase with a 3.5% decline and year-to-year inventories are down 15.3%. At the current sales rate there was a 9.6 months' supply on the market which was near the lowest since 2007. For single-family homes the inventory also fell 3.3% (-15.8% y/y). At the current sales rate there was a 9.0 month's supply, near the lowest since 2007.
The data on existing home sales, prices and affordability can be found in Haver's USECON database. The regional price, affordability and inventory data is available in the REALTOR database.
Why has home ownership fallen among the young? from the Federal Reserve Bank of Chicago can be found here.
| Existing Home Sales (Thous) | May | April | Y/Y | 2008 | 2007 | 2006 |
|---|---|---|---|---|---|---|
| Total | 4,770 | 4,660 | -3.6% | 4,893 | 5,674 | 6,516 |
| Northeast | 800 | 770 | -10.1 | 845 | 1,010 | 1,093 |
| Midwest | 1,090 | 1,000 | -4.4 | 1,130 | 1,331 | 1,494 |
| South | 1,740 | 1,740 | -8.9 | 1,860 | 2,243 | 2,577 |
| West | 1,140 | 1,150 | 11.8 | 1,064 | 1,095 | 1,357 |
| Single-Family | 4,250 | 4,170 | -3.0 | 4,341 | 4,960 | 5,712 |
| Median Price, Total, $ | 173,000 | 166,600 | -16.8 | 197,250 | 216,633 | 222,042 |
by Tom Moeller June 23, 2009
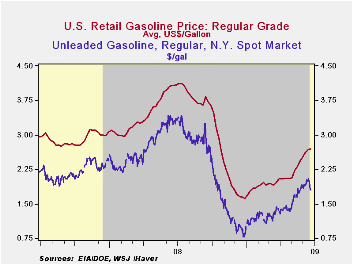
Tentative signs of recovery in the U.S. economy have recently become more vague. The immediate effect of this backpedaling is evident in energy markets where the cash market price for a gallon of regular gasoline is down roughly twenty-five cents during just the last week. Yesterday, the cash market price for a gallon of regular gasoline was $1.79 versus the daily high of $2.04 last week and the weekly average of $1.98. If sustained these declines likely be reflected in the retail price for regular gasoline which last week rose slightly to an average $2.69 per gallon of regular. That increase pulled prices up by more than $1.00 per gallon, or by more than one-half, from the December low to the highest level since late-October. The figures are reported by the U.S. Department of Energy and can be found in Haver's WEEKLY & DAILY databases.
The tenuous nature of the recovery also is reflected in a lower price for crude oil. Crude prices dropped yesterday to $66.93 from last week's high of $71.37 and from an average $70.61 last week for a barrel of West Texas Intermediate. The speculation of weaker demand came against the backdrop of a 3.8% year-to-year rise in crude oil production during the latest four weeks. In addition, oil is plentiful as evidenced by a 13.4% y/y rise in inventories of crude oil & petroleum products. The figures on crude oil production and inventories are available in Haver's OILWKLY database.
Finally, an earlier plateau of natural gas prices was sustained. The Monday price of $3.96 per mmbtu (-69.4% y/y) held roughly steady with last week but that price was up slightly from the earlier low of 3.56. Current prices are down by two-thirds from the high reached in early-July of $13.19/mmbtu.
Fighting Downturns with Fiscal Policy from the Federal Reserve Bank of San Francisco is available here.
| Weekly Prices | 06/22/09 | 06/15/09 | Y/Y | 2008 | 2007 | 2006 |
|---|---|---|---|---|---|---|
| Retail Regular Gasoline ($ per Gallon, Regular) | 2.69 | 2.67 | -34.0% | 3.25 | 2.80 | 2.57 |
| Light Sweet Crude Oil, WTI ($ per bbl.) | 70.61 | 70.83 | -47.5% | 100.16 | 72.25 | 66.12 |
by Tom Moeller June 23, 2009
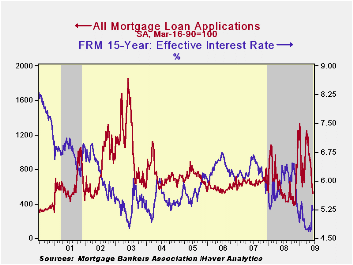
The latest data from the Mortgage Bankers Association strongly suggest that the refinancing boom has reached an end. Overall, mortgage applications dropped sharply last week to the lowest level since last November. The moderate increase in interest rates is behind the lessened attractiveness of refinancing. The 15.8% w/w drop in overall mortgage applications was led by a collapse in refis. Last week, they dropped by one-quarter from the prior week and they are off by 80% during just the last two months.
While still low by historical standards, rates indeed have
moved off the lows. And it's at the margin that activity is affected
most. The effective interest rate on a conventional 15-year mortgage
jumped last week to 5.24% and the rate is up by more than 50 basis
points from the April low. For a 30-year mortgage, rates also rose to
5.68% versus the 4.81% low. Interest rates on 15- and 30-year mortgages
are closely correlated (>90%) with the rate on 10-year Treasury
securities. Up also were adjustable 1-Year mortgage rates at 6.56%
versus the low close to 6.0% during January. The rate still was down,
however, sharply from the 7.07% peak reached this past fall.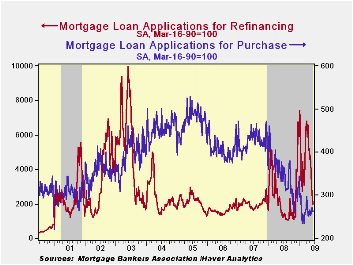
Despite the drop in re-fis, the interest in home buying appears intact. Purchase applications slipped last week but for June so far applications are 1.6% higher than during May. That follows the trend in new plus existing home sales.
During the last ten years there has been a (negative) 79% correlation between the level of applications for purchase and the effective interest rate on a 30-year mortgage. Moreover, during the last ten years there has been a 61% correlation between the y/y change in purchase applications and the change in new plus existing single family home sales.
The figures for weekly mortgage applications are available in Haver's SURVEYW database.
The Mortgage Bankers Association surveys between 20 to 35 of the top lenders in the U.S. housing industry to derive its refinance, purchase and market indexes. The weekly survey covers roughly 50% of all U.S. residential mortgage applications processed each week by mortgage banks, commercial banks and thrifts. Visit the Mortgage Bankers Association site here.
| MBA Mortgage Applications (3/16/90=100) | 06/12/09 | 06/05/09 | Y/Y | 2008 | 2007 | 2006 |
|---|---|---|---|---|---|---|
| Total Market Index | 514.4 | 611.0 | 1.2% | 642.9 | 652.6 | 584.2 |
| Purchase | 261.2 | 270.7 | -27.5% | 345.4 | 424.9 | 406.9 |
| Refinancing | 1,998.1 | 2,605.7 | 44.9% | 2,394.1 | 1,997.9 | 1,634.0 |
by Louise Curley June 23, 2009
While the World Bank has down graded its forecast for Euro
area growth this year to -4.5% from its earlier forecast of -2.7%,
indicators of French and German Business confidence have become less
pessimistic, although they are still negative. Yesterday, the German
IFO reported an improvement in its Business Climate indicator and
today, France's INSEE (National Institute of Statistics and Economic
Studies) reports that its Composite Business Indicator has risen to 73
in June from 71 in May and 68 in April. Both the Industry and Services
components of the Composite Indicator, show similar rises and the
Construction component has held steady at 92. The components of the
Composite Indicator are shown in the first chart.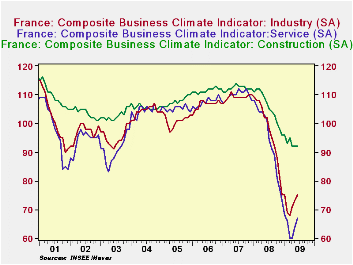
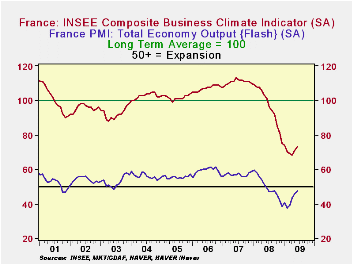
The June preliminary or "flash" result from the Markit Economics Purchasing Managers' Survey for France, released today, also suggests that business is becoming less pessimistic. The diffusion index for the purchasing managers' views on the total economy is 47.7, close to the 50 mark above which expansion is indicated.
The second chart shows the INSEE indicator against its long term average* and the results of the Markit Economics Purchasing Managers' Survey against the 50% line that divides expansion and contraction. The purchasing managers appear to be the less pessimistic.
The INSEE indicator is so constructed that its long term average is 100 and its standard deviation, 10.
| Jun 09 | May 09 | Apr 09 | Mar 09 | Y/Y % | 2008 | |
|---|---|---|---|---|---|---|
| Composite Business Indicator (LT Ave = 100) | 73 | 71 | 68 | 69 | 70 | 78 |
| Industry | 75 | 73 | 71 | 68 | 69 | 75 |
| Construction | 92 | 92 | 92 | 95 | 93 | 96 |
| Services | 67 | 64 | 60 | 60 | 66 | 68 |
by Robert Brusca June 23, 2009
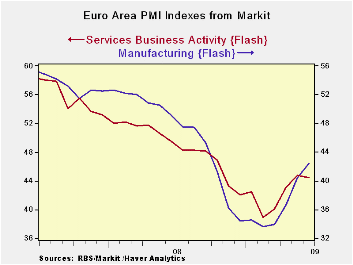
Markit PMIs composite index rises - The
Euro Area FLASH PMI for MFG rose in June but that happy event was
partly offset by a decline in the region’s services survey. The
composite index comprised of both MFG and Services rose to 44.4, its
highest reading since September of 2008. The composite index stood at
44 in May.
In Manufacturing
In Germany the country level index for MFG rose to 40.5 from
39.58 in May, its highest level since October of last year.
In France the MFG index moved up to 45.5 from 43.32 in May,
reaching its highest point since August of 2008.
The moving averages for MFG show levels are still below those
of 12 months ago but the EMU trend has been improving and the current
level of the MFG index is above the 12-mo 6-mo and 3-mo moving
averages. That is very good for momentum.
The Service Sector
The services gauge for all of EMU fell in June but remains
above the level for April having only seen backsliding for one month’s
worth of gains. The same is true of the services slippage in France and
in Germany; each lost only one month’s worth of gains. Still, in
Germany the service index stands at 44.3 in the just the 15th
percentile of its historic range. For France the index is at 47.5 and
stands in the 32nd percentile of its range. In contrast Germany’s MFG
index stands in the 31st percentile of its range, not nearly as low as
for services; France’s MFG index stands in the 47th percentile of its
range also superior to its relative reading for services. For all of
EMU the services index stands near the 25th percentile of its range
compared to a standing at the 34th percentile for MFG. The
manufacturing sector is now beginning to be more of an engine of growth
after the services sector had provided the role of support when the
economic scene was unraveling in Europe.
A note on MFG/Services comparison
Note that absolute reading for services is superior to that
for MFG but that for MFG the current reading is at a higher percentile
in its range. The percentile reading is a better gauge to use to
compare one index to another since MFG indices span a broader range of
values and since the Services index has higher reading on average. The
services reading average nearly FOUR points higher than the MFG
readings. So on several bases the MFG index now is relatively stronger
than services despite the higher absolute monthly reading for services.
Over comparable periods the standard deviation of the MFG index is 5.41
compared to 4.72 for services making the MFG sector some 14% more
variable than services and 20% more volatile relative to its mean. The
service index is relatively sluggish compared to the MFG index, as we
well know. Not surprising then that MFG is the best DIRECTIONAL index.
Fortunately it is moving UP now.
Perspective
Manufacturing is now on the strongest rising gradients for
EMU. The service sector index has paused and lost some momentum. Still
the overall picture and trend remains positive.
Another sign of progress this morning came from the Belgian
National Bank index which trimmed its negative reading to -23.6 in June
from -27.6 in May. For that index it is the best reading since November
2008.
In terms of these index readings, we see in the Markit PMIs
the best MFG and Services (for services based on the May reading)
readings since August – October of last year and in the Belgian series
the best reading since November. On balance it is looking like a
reasonably well balanced rebound is taking place across the Zone in
these countries and across their various sectors, at least as judged by
the measures presented here. Of course, all the respective measures
still point to continuing losses. But these indices speak to the fact
that the speed of the loss has been cut sharply from the lows showing
that the pace of decline is back to the pace last seen in early Q4 or
late Q3 of 2008.
The MFG ands Services PMIs each were last above 50 in May of
2008. The Belgian bank index was last positive in May of 2008 as well.
How soon we get back there depends on quickly this incipient recovery
traces its own steps. For now it is on the right path and the pace of
recovery is a good one, service sector (perhaps) excepted.
| FLASH Readings | ||
|---|---|---|
| Markit PMIs for the Euro Area | ||
| MFG | Services | |
| Jun-09 | 42.37 | 44.49 |
| May-09 | 40.68 | 44.82 |
| Apr-09 | 36.83 | 43.76 |
| Mar-09 | 33.93 | 40.95 |
| Averages | ||
| 3-Mo | 37.15 | 44.10 |
| 6-Mo | 35.55 | 42.29 |
| 12-Mo | 39.92 | 44.22 |
| 127-Mo Range | ||
| High | 60.47 | 62.36 |
| Low | 33.55 | 39.24 |
| % Range | 32.8% | 22.7% |

Tom Moeller
AuthorMore in Author Profile »Prior to joining Haver Analytics in 2000, Mr. Moeller worked as the Economist at Chancellor Capital Management from 1985 to 1999. There, he developed comprehensive economic forecasts and interpreted economic data for equity and fixed income portfolio managers. Also at Chancellor, Mr. Moeller worked as an equity analyst and was responsible for researching and rating companies in the economically sensitive automobile and housing industries for investment in Chancellor’s equity portfolio. Prior to joining Chancellor, Mr. Moeller was an Economist at Citibank from 1979 to 1984. He also analyzed pricing behavior in the metals industry for the Council on Wage and Price Stability in Washington, D.C. In 1999, Mr. Moeller received the award for most accurate forecast from the Forecasters' Club of New York. From 1990 to 1992 he was President of the New York Association for Business Economists. Mr. Moeller earned an M.B.A. in Finance from Fordham University, where he graduated in 1987. He holds a Bachelor of Arts in Economics from George Washington University.
More Economy in Brief


